mbg@portfolio:~/research-rigor · case study 07 · read 6 min
Quiet search --:--:--
$ cd case_07/research-rigor
// selected studies from a decade as an IC researcher inside Dell

Research rigor.

There's an old research adage: you are not the user. I was the user. A decade of IT in the seat. And I still wanted to understand the mental model of the IT Professional deeper than my own. So I toyed with every method I could get my hands on and worked them into our research roadmap quietly, without pushing, learning from the classically-trained PhDs around me. The technical background was already there. What I built on top of it was a research practice, and eventually a reputation as one of the better researchers on the team without the credential to match.

Role
IC researcher
Hands-on across the full research stack
Volume
55+ studies
Across enterprise verticals and LOBs
Methods
Qual & Quant
IDIs, focus groups, surveys, diaries, heuristic audits
Domain
Datacenter · Edge · Telco
IT Pros as the core user population
01 The Frame why this work still matters to me

A decade as an IC researcher shapes how I lead research now.

As a Sr. Manager I set direction now, I don't moderate sessions myself. But the years I spent in the seat shape how I read research today, how I coach my team, and how I push back when a finding is being bent toward a preferred conclusion.

02 Customer Journey to Adaptive Scalability research synthesis · foresight · 2021—2022

Hundreds of research artifacts, synthesized into one strategic narrative for senior leadership.

Abstract 2021—2022 · Synthesis of hundreds of research artifacts across the group · Audience: Dell senior leadership (CTOs, SVPs) · Six-layer industry trajectory from component scalability to intelligent automation · Outcome: significant investment in cloud and AI funding lines, anchored in a shared customer-journey model.

This wasn't a study I ran. It was a synthesis I helped build, sitting alongside two Dell Technical Fellows and three Distinguished Engineers. They held the technical foresight; my role was to bring the customer perspective forward and to be the visual architect for the journey map itself, translating their layered model into something that could land with non-technical executives.

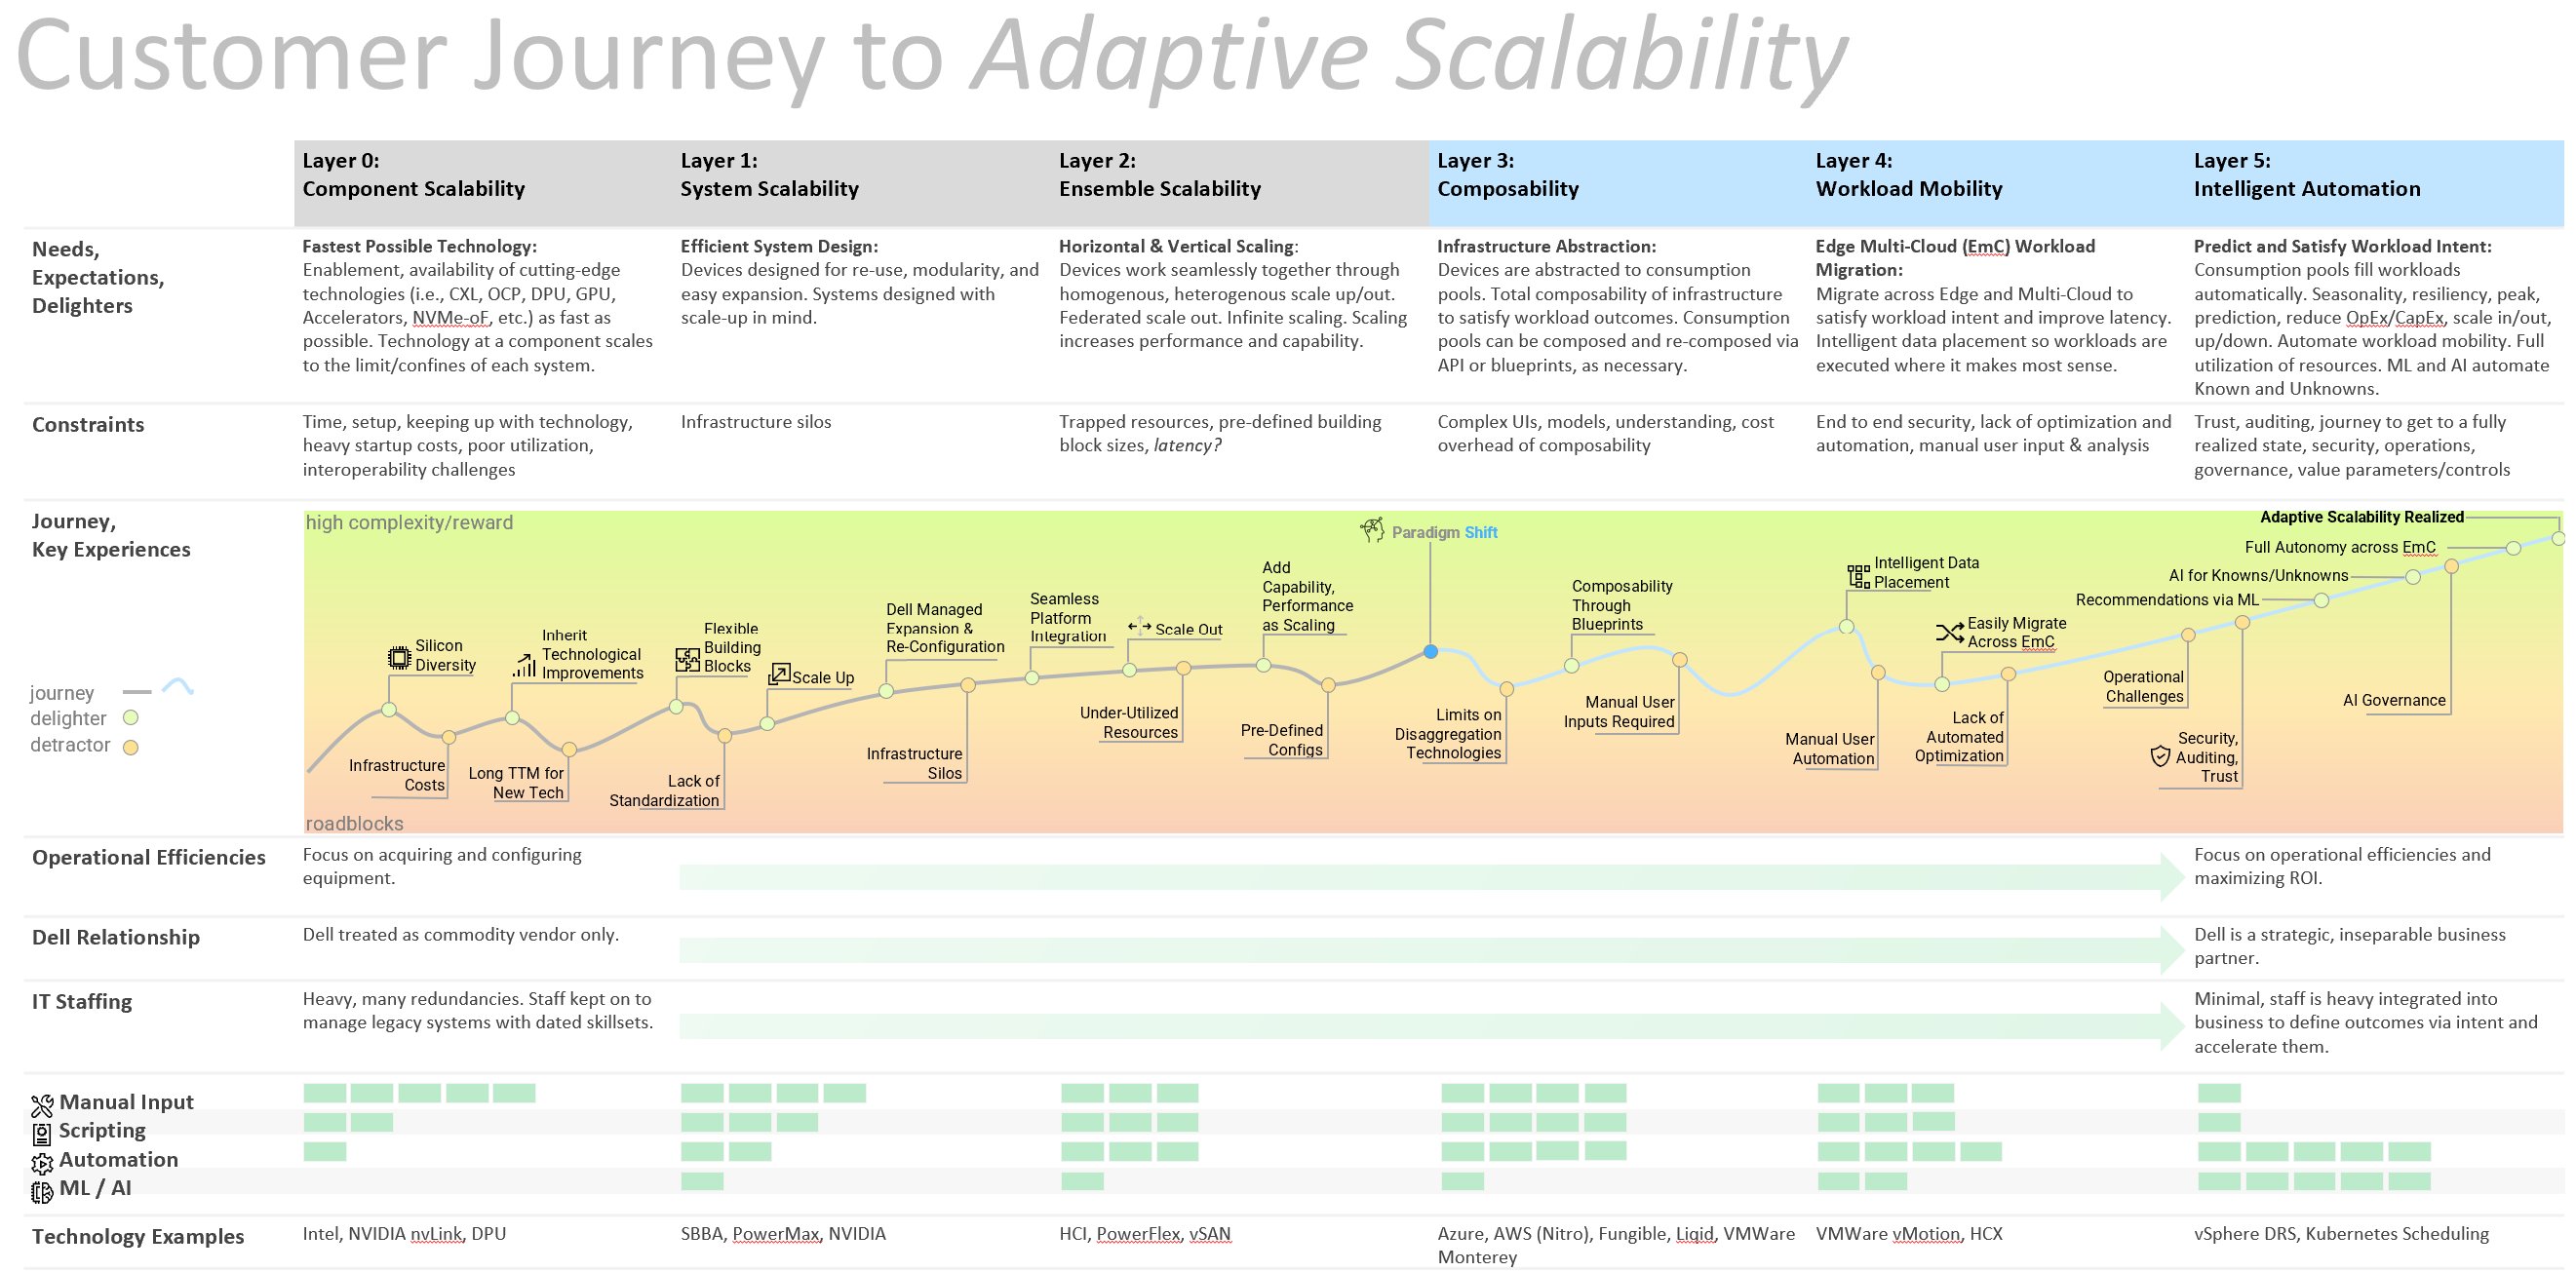
The map traces a six-layer trajectory: Component Scalability, System Scalability, Ensemble Scalability, Composability, Workload Mobility, Intelligent Automation. Each layer carries its own customer needs, constraints, and a journey curve of delighters and detractors. The right side of the map (Composability through Intelligent Automation) is where Dell needed to invest if it wanted to be a strategic partner rather than a commodity vendor.

The artifact below is the deliverable that went to senior leadership. It directly informed significant investment in both cloud and AI funding lines downstream.

Customer Journey to Adaptive Scalability — six-layer journey map from Component Scalability through Intelligent Automation, showing customer needs, constraints, journey curve with delighters and detractors, operational efficiencies, Dell relationship evolution, IT staffing, automation maturity, and technology examples per layer
FIG. 01 The full journey map. Six layers across the top, customer needs and constraints down the side, the journey curve through the middle, and per-layer technology examples along the bottom. Built to be readable in one sitting by a CTO and to support a thirty-minute strategy conversation.
03 IT Pro Infrastructure Survey quant · 500-respondent online survey · 2021

Five hundred IT Pros, surveyed across infrastructure, cloud, and evolving job roles.

Abstract n=500 · Online survey developed by Dell's Enterprise Experience Design Group · Fielded by Human Interfaces Inc., June—August 2021 · U.S.-based IT professionals across roles and organization sizes · Topics: current and future infrastructure, cloud, server footprint · 71% had at least one cloud type, 47% had moved to managerial in two years, and the population was more hybrid than IDIs alone implied.

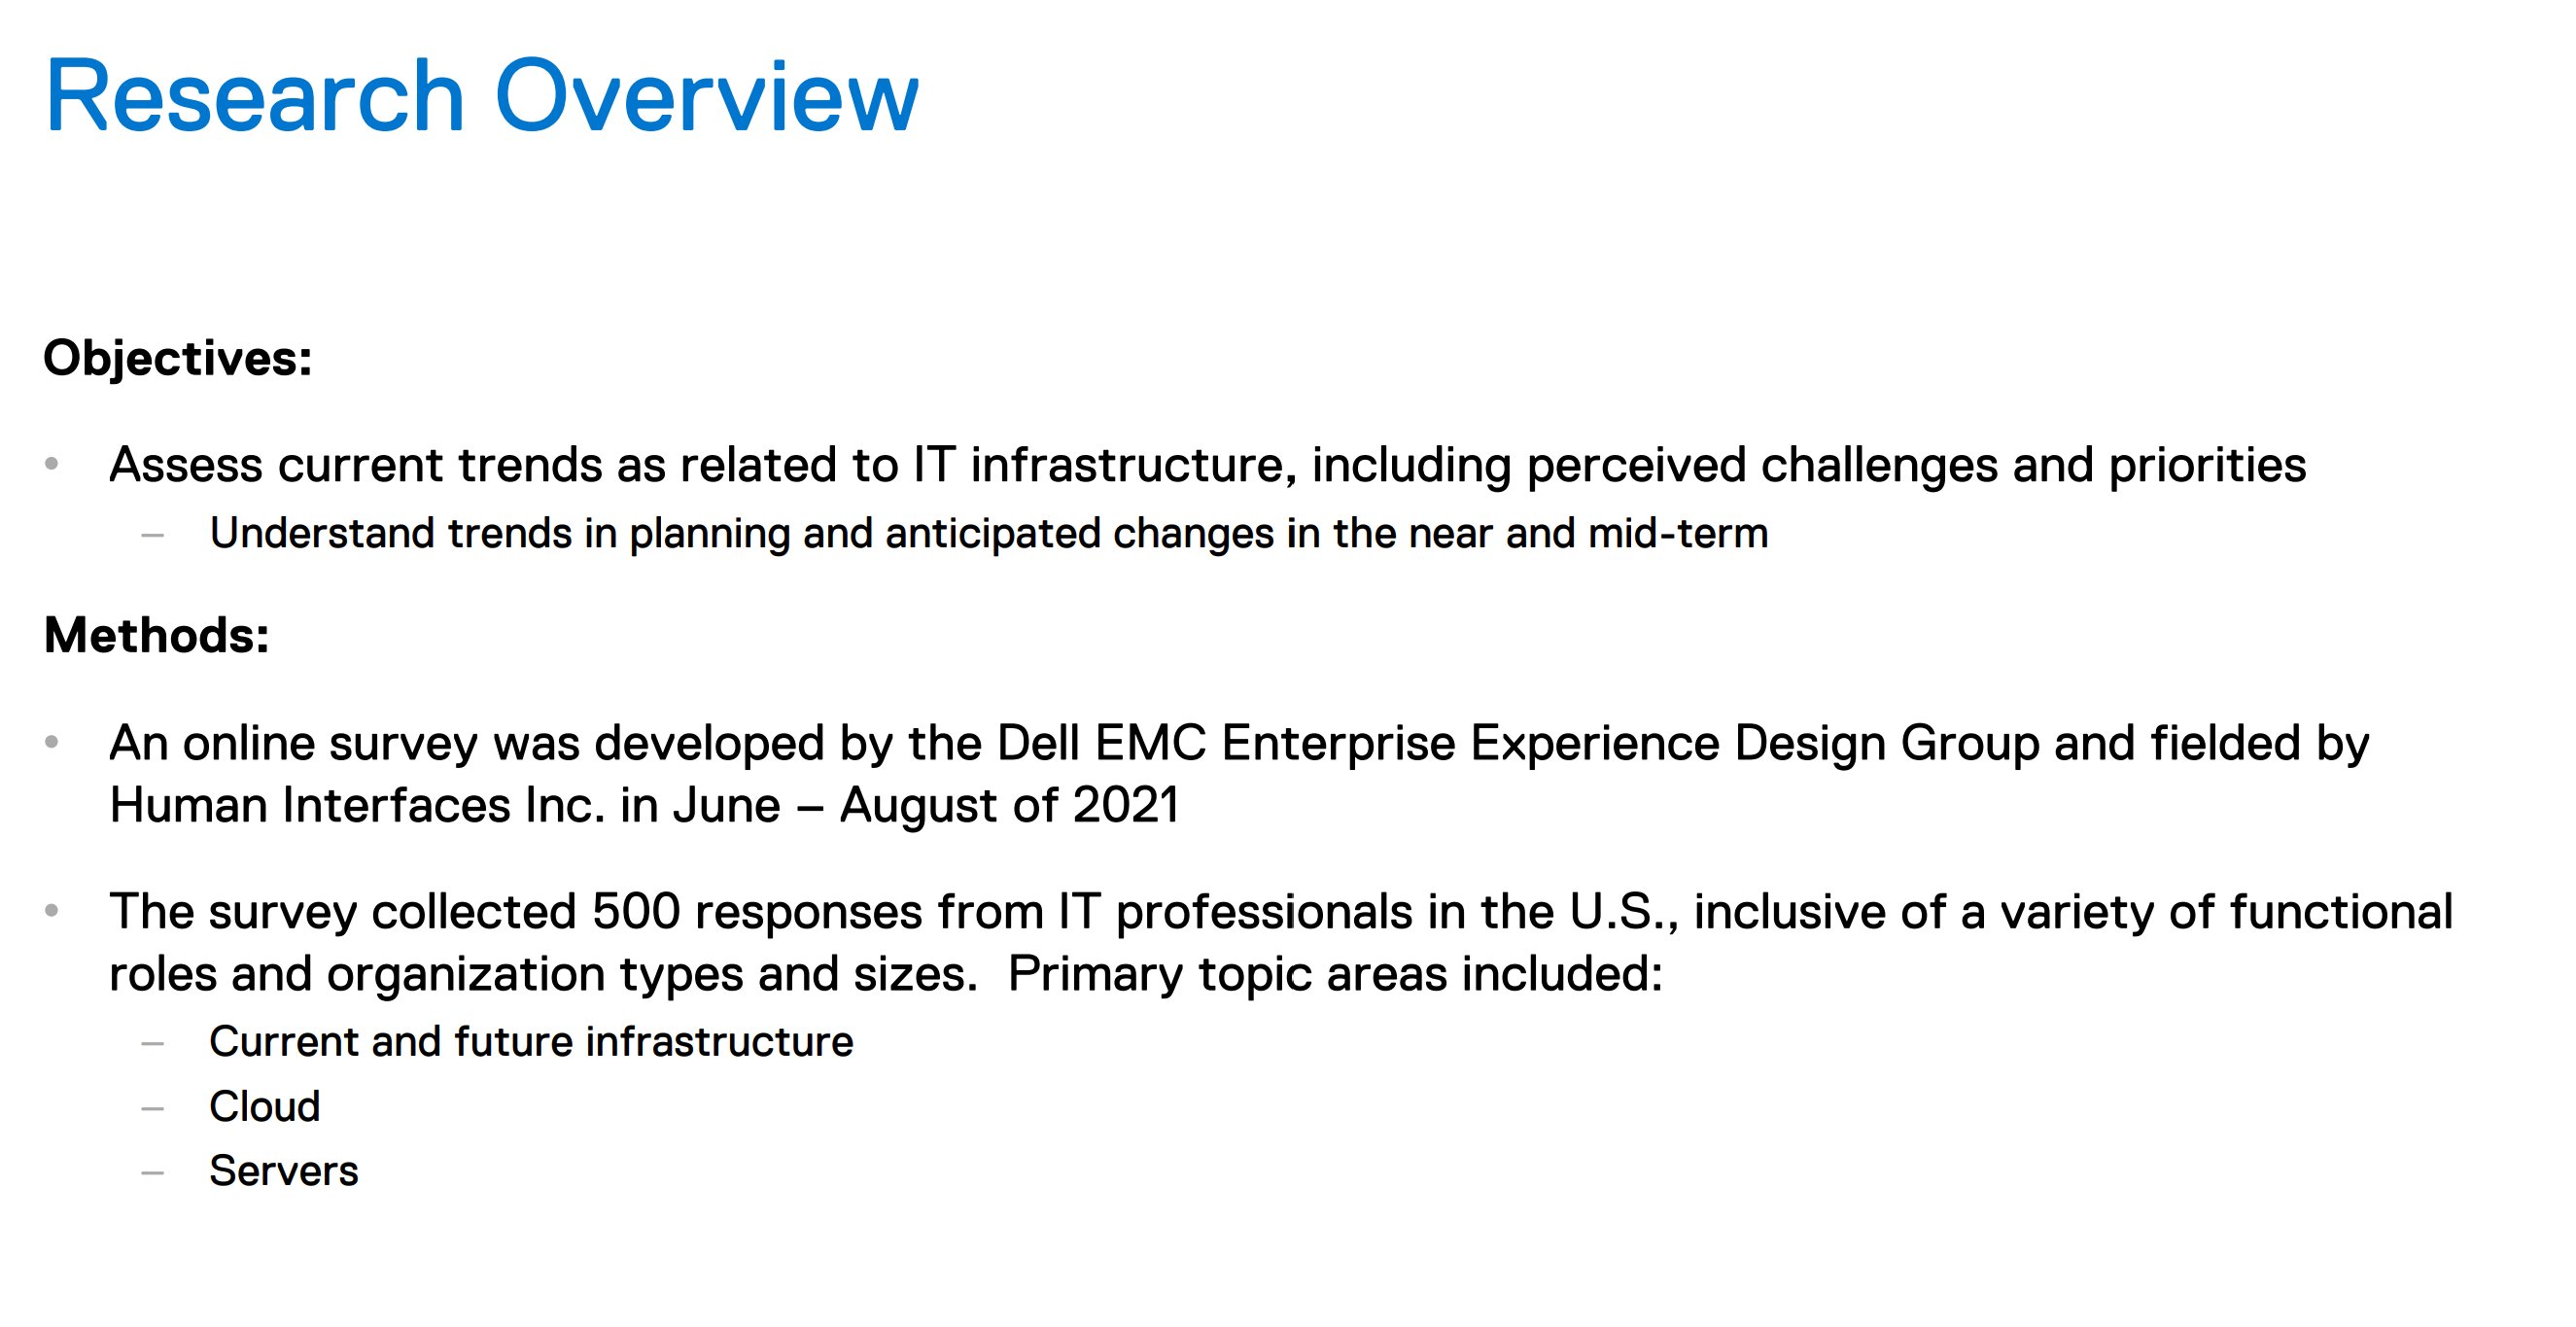
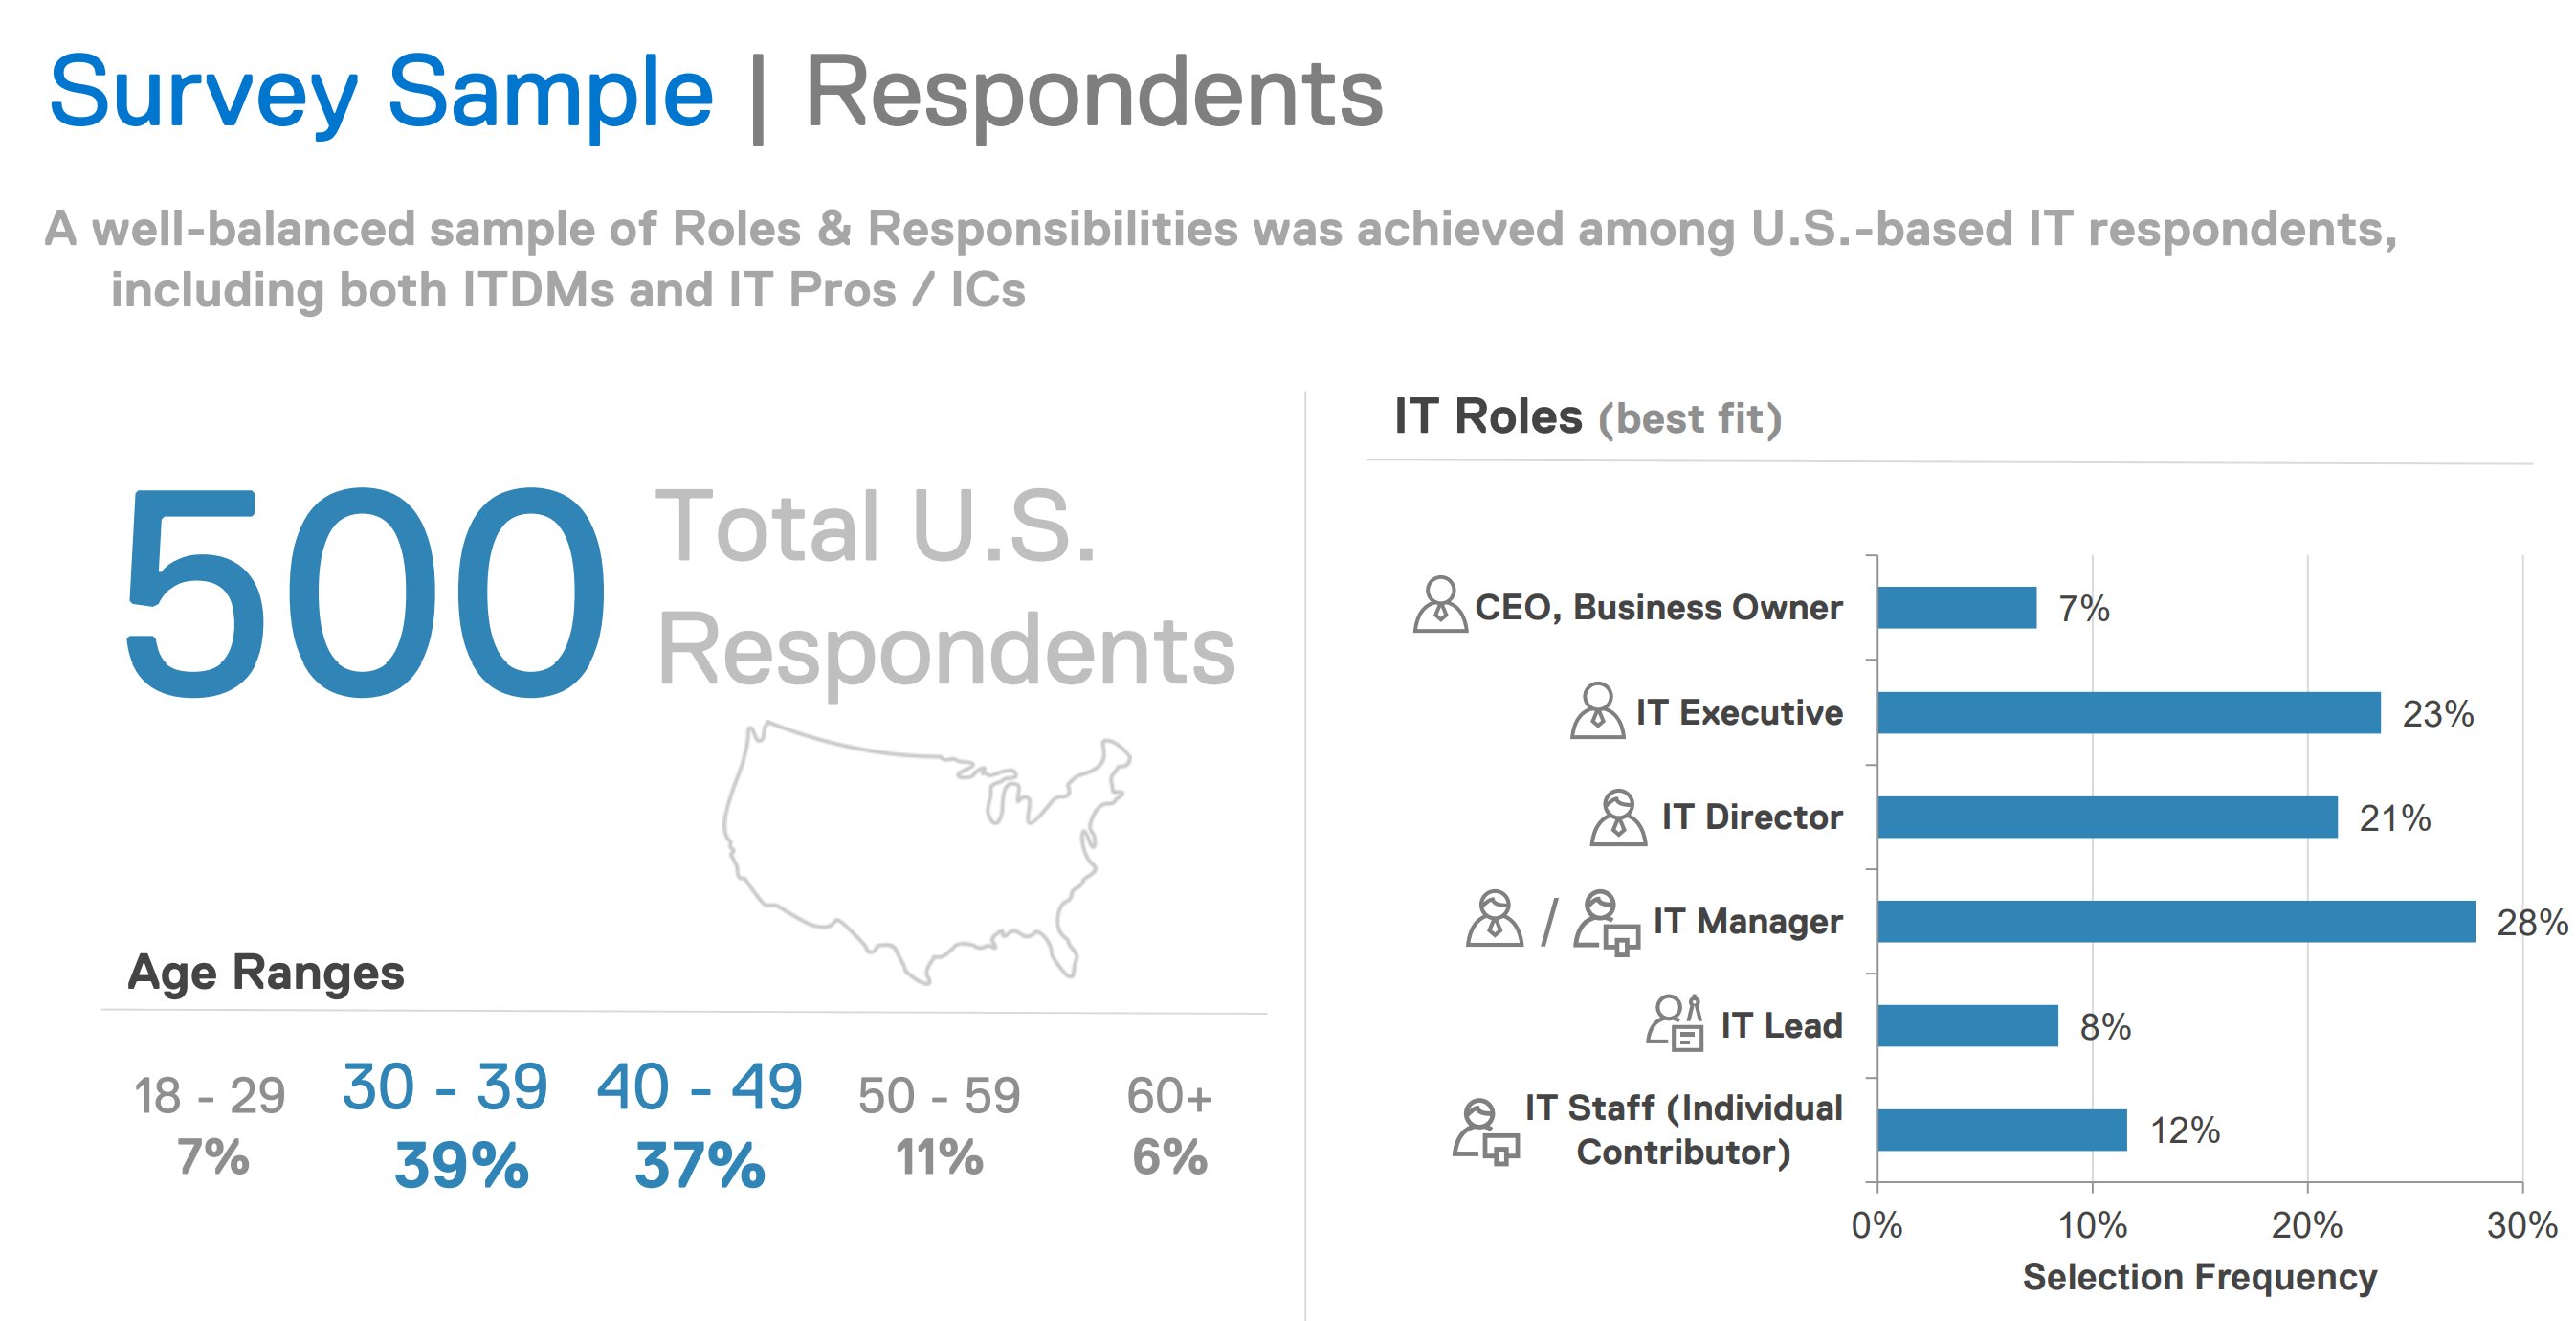
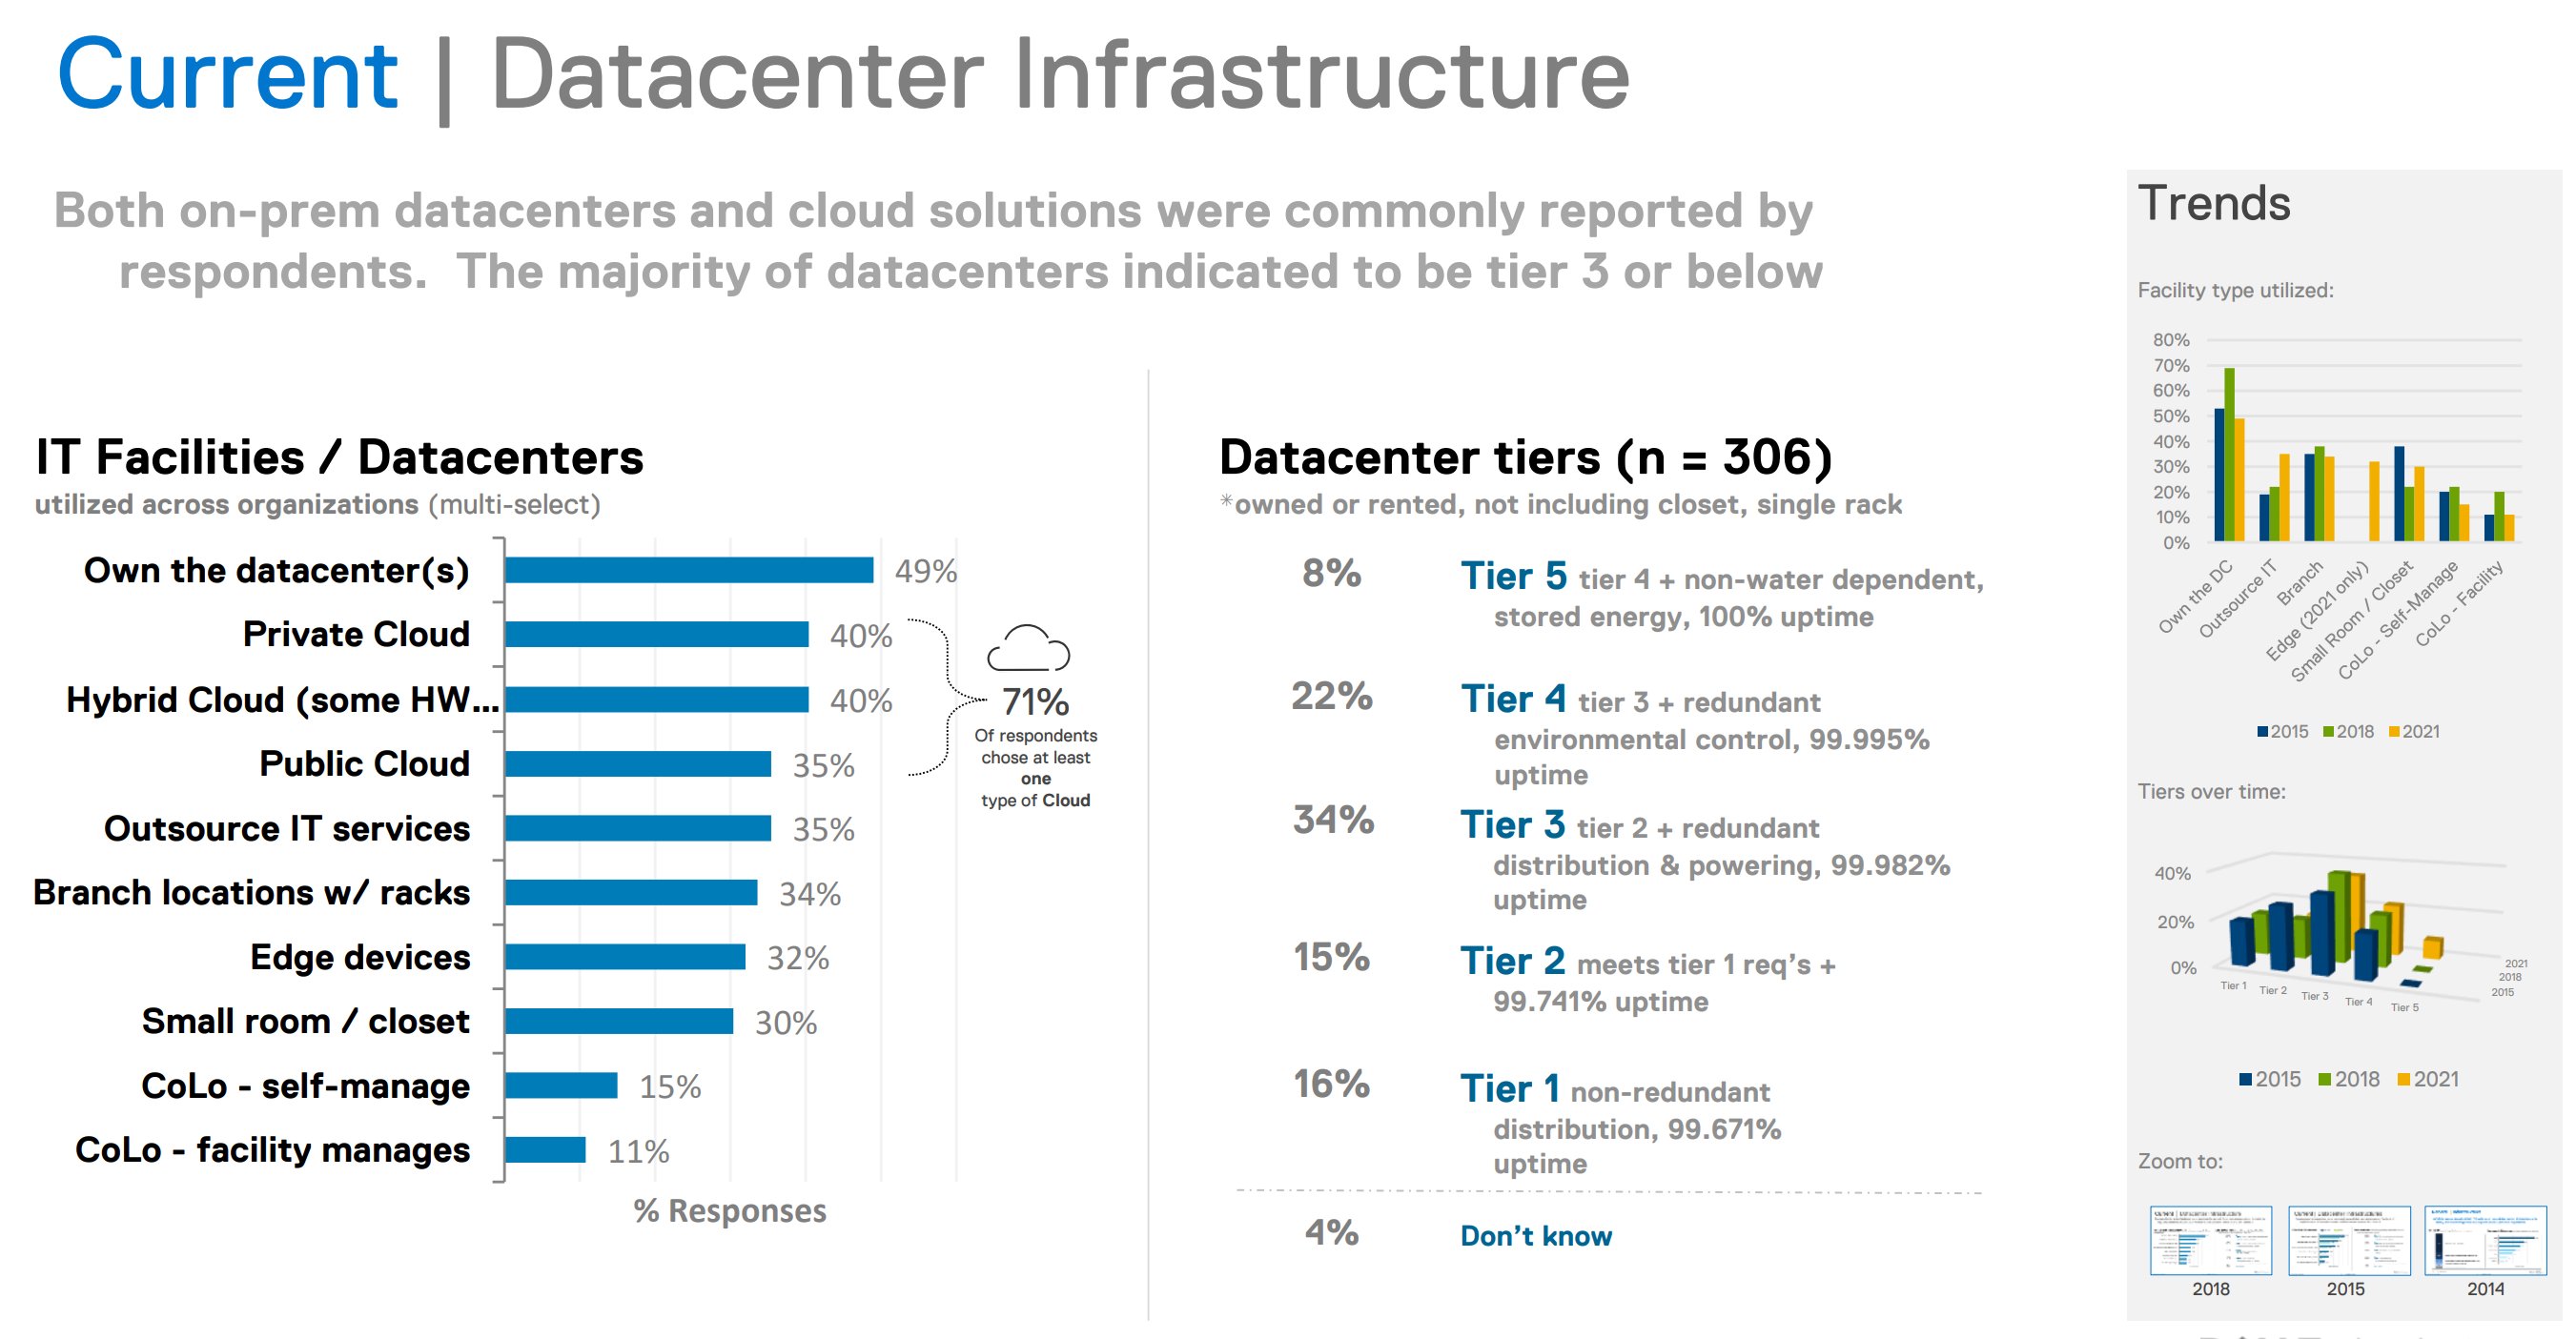
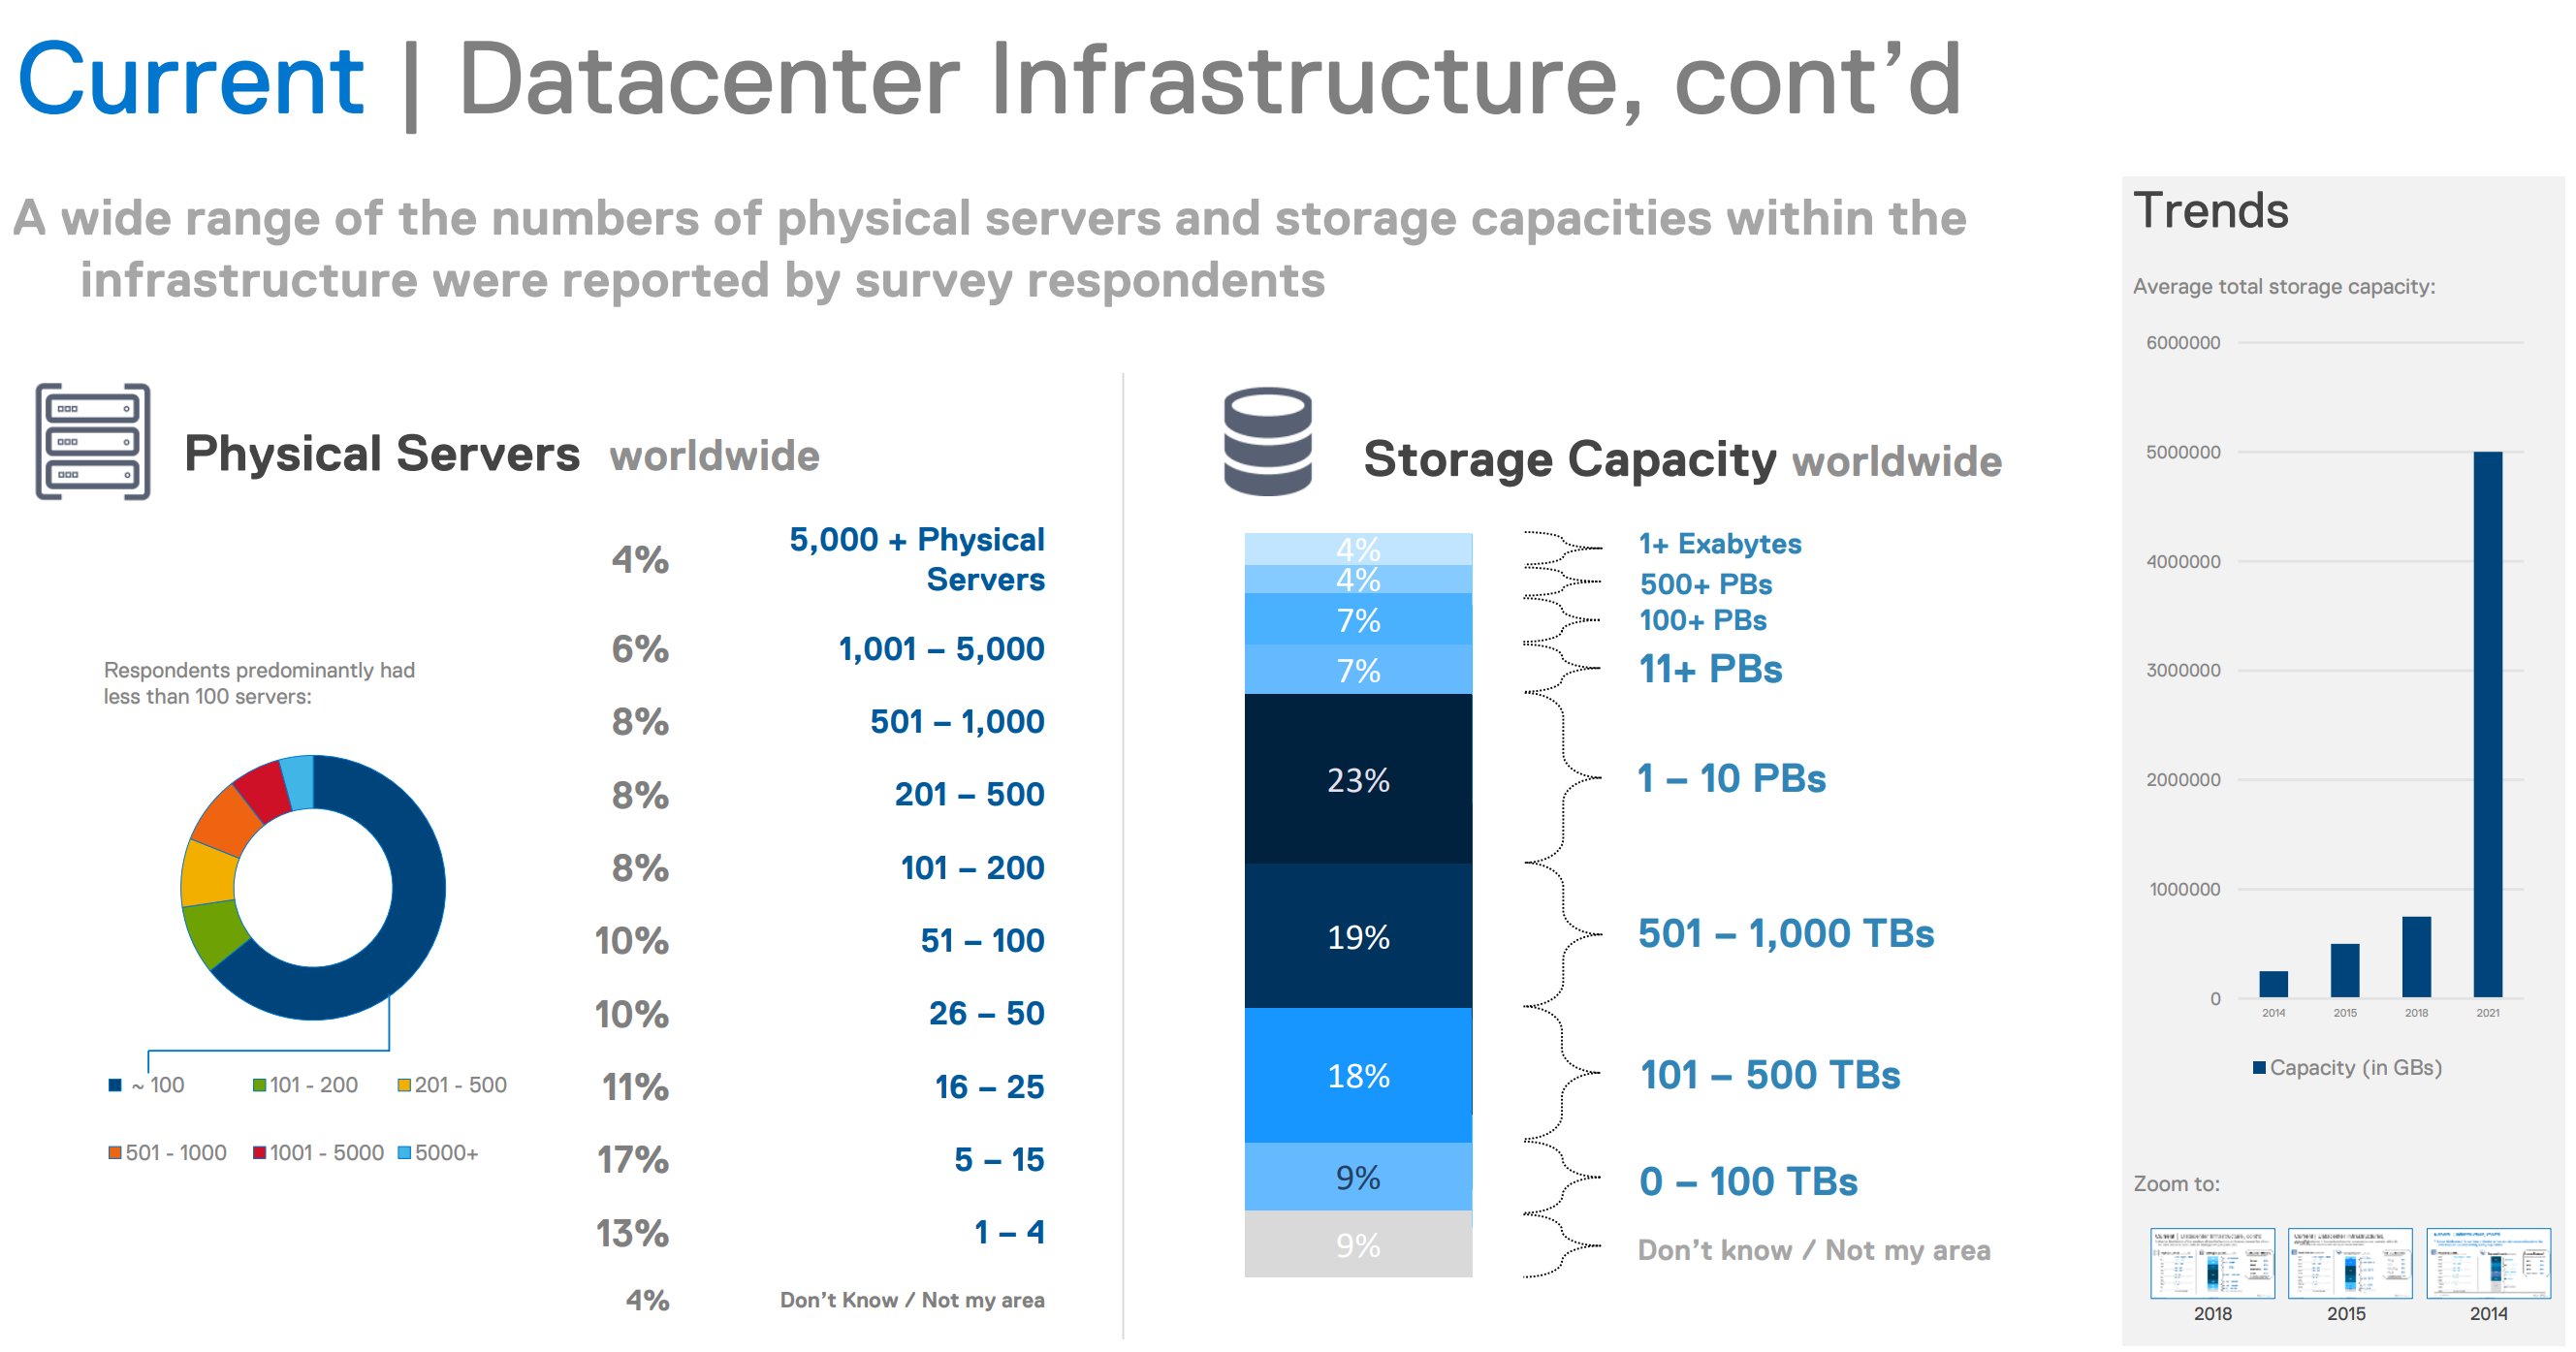
The IDIs we ran covered the IT Pro population in depth, not breadth. Fifteen people, two hours each, deep mental-model work. But we kept extrapolating from small samples, and we wanted to test whether what we were seeing held at scale. Five hundred U.S.-based IT professionals, online survey, fielded by Human Interfaces Inc. across June through August 2021. Topic areas spanned current and future infrastructure, cloud adoption, and physical server footprint.

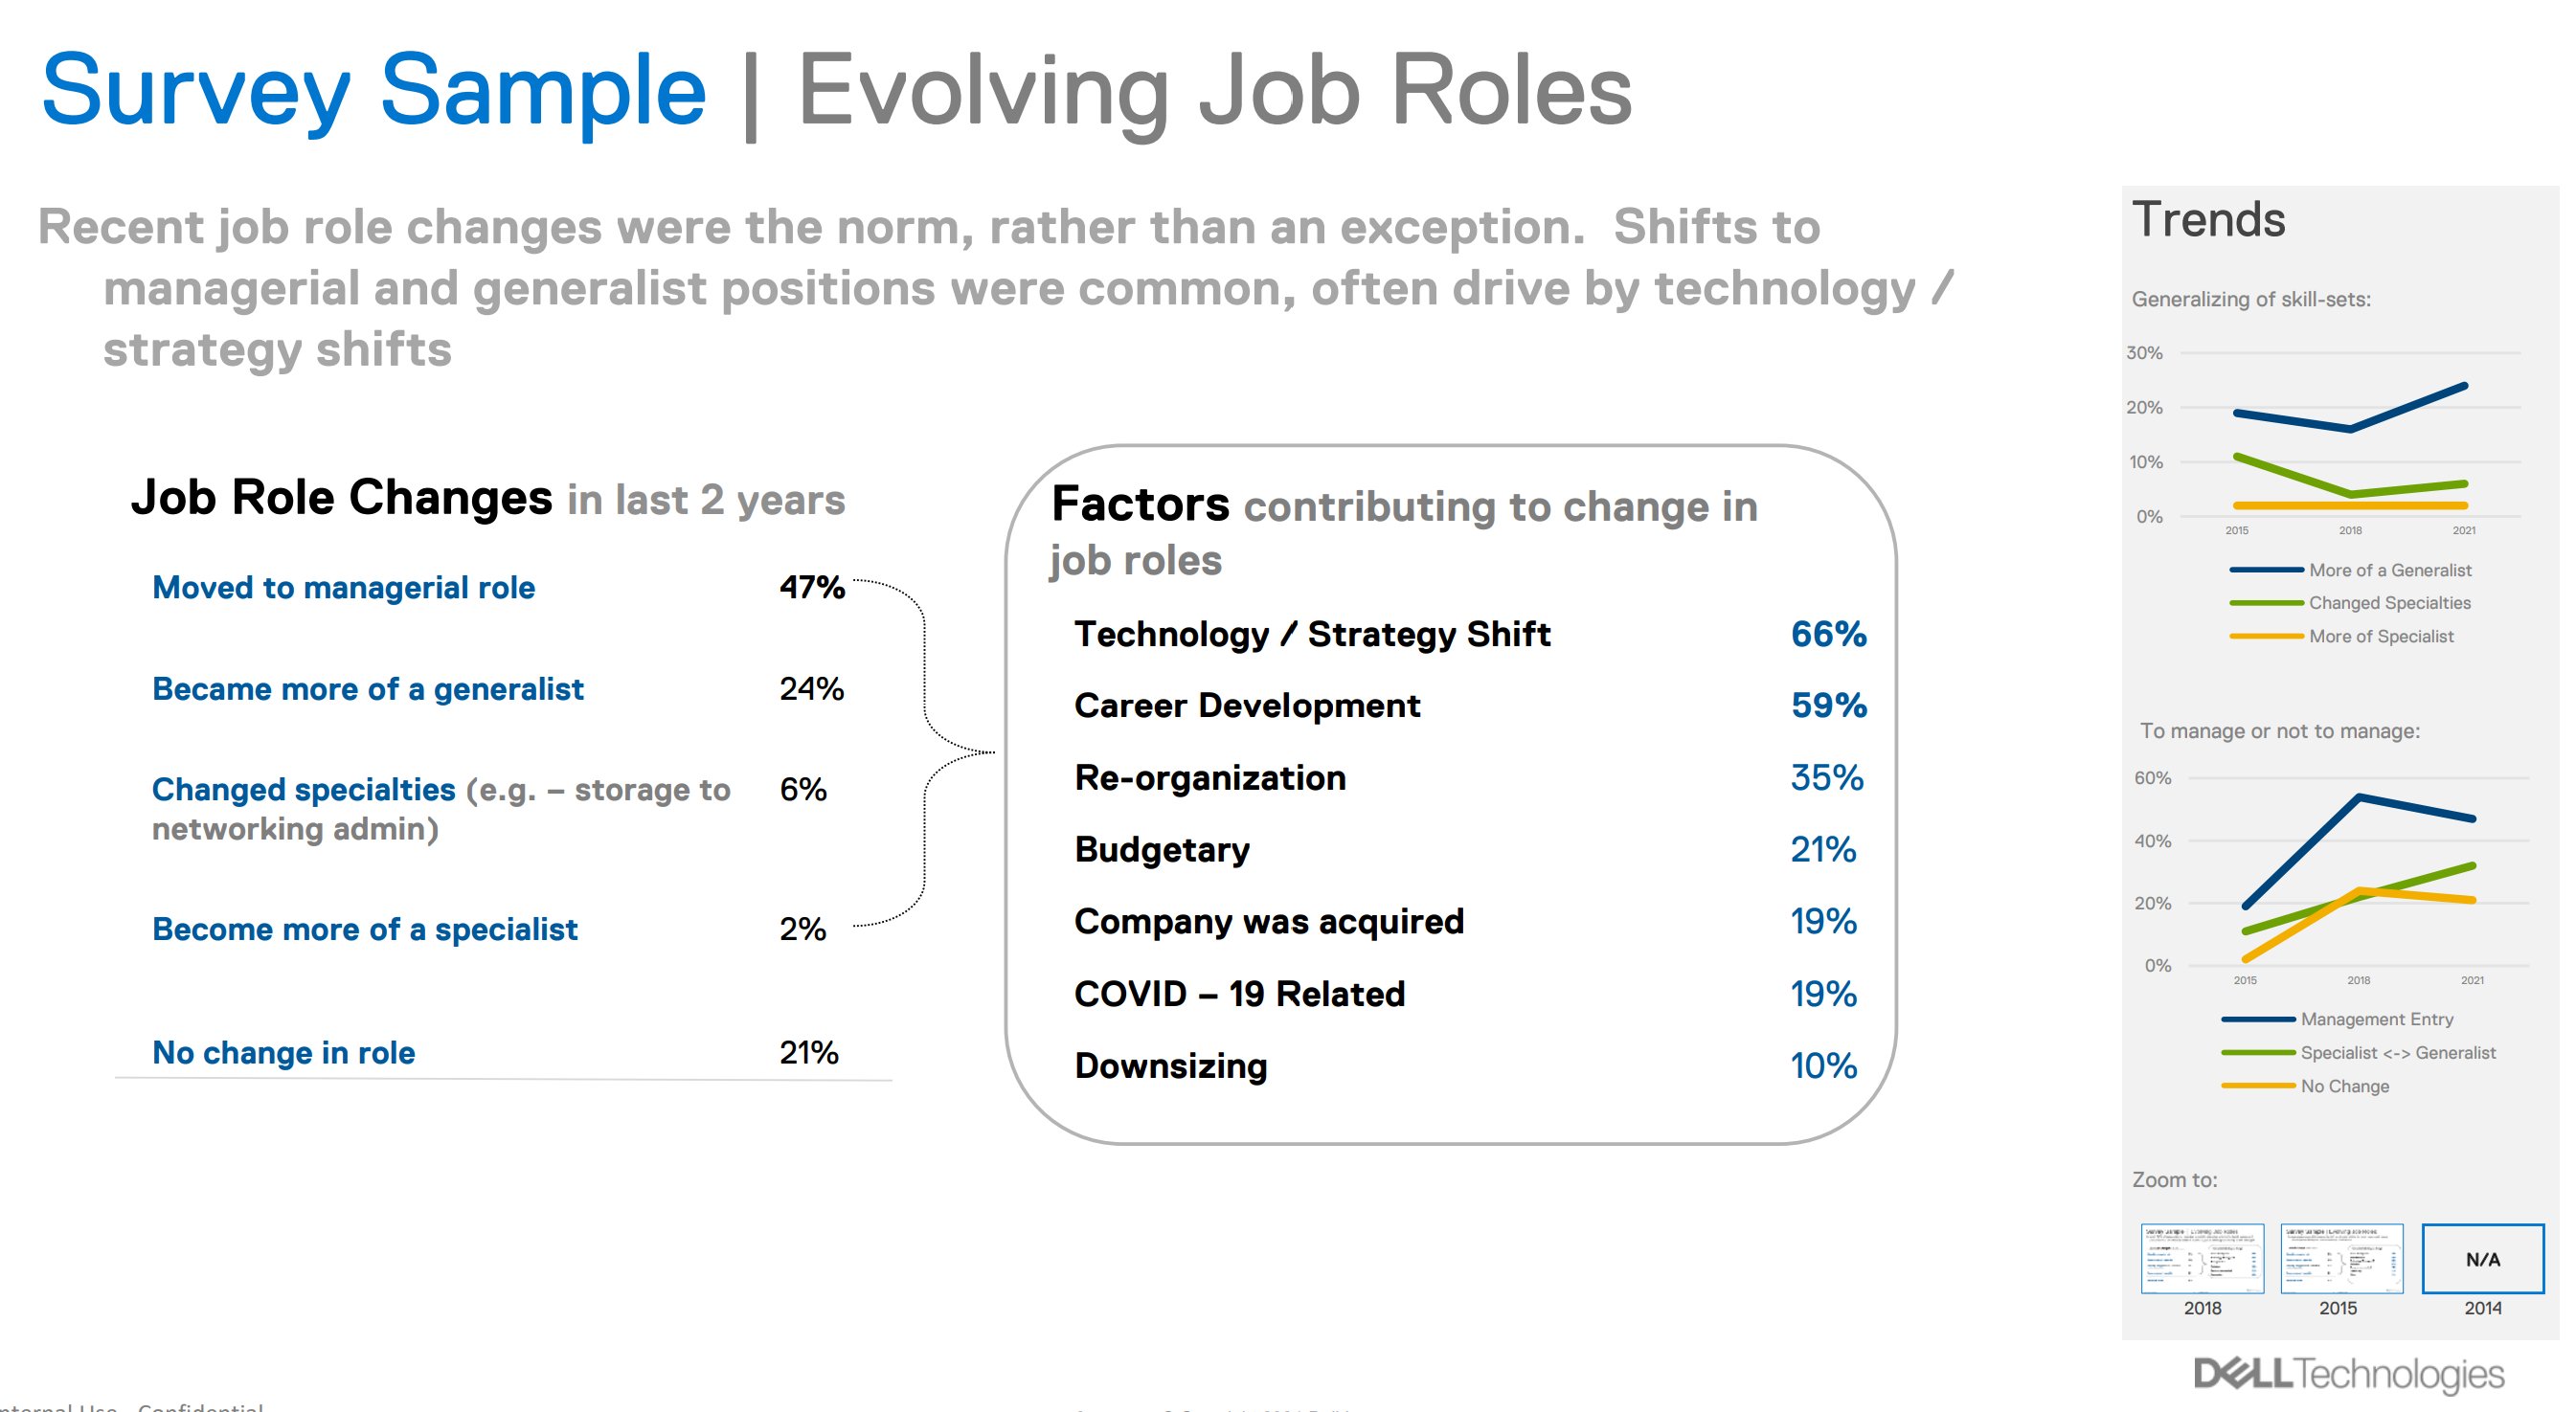
What confirmed: the population was in real flux. 47 percent had moved to a managerial role in the last two years, and technology-and-strategy shift was the dominant driver of role change at 66 percent. What complicated: cloud coverage was effectively universal at 71 percent, datacenter mix skewed hybrid more than the IDIs alone suggested, and the scale distribution was so wide that almost no statement about the average IT Pro was true. The respondent base ran from people managing four servers to people managing five thousand or more.

Research overview slide listing objectives and methods. Online survey developed by Dell EMC Enterprise Experience Design Group, fielded by Human Interfaces Inc. in June through August 2021, n=500 IT professionals in the U.S., topics include current and future infrastructure, cloud, and servers
FIG. 00 Research overview. Methodology and topic areas, included for context. The findings figures follow.
Survey sample composition slide showing 500 total U.S. respondents balanced across age and role. Age ranges concentrated in 30-39 (39 percent) and 40-49 (37 percent). IT roles include CEO/Business Owner 7 percent, IT Executive 23 percent, IT Director 21 percent, IT Manager 28 percent, IT Lead 8 percent, IT Staff 12 percent
FIG. 01 Sample composition. 500 U.S.-based IT respondents, balanced across age and role. ITDMs (CEO through Manager) made up 79 percent of the sample; IT Leads and ICs the remaining 20 percent.
Survey results on evolving job roles. 47 percent moved to a managerial role in the last 2 years, 24 percent became more of a generalist, 21 percent had no change. Top contributing factor: Technology/Strategy Shift at 66 percent. Trend charts show generalizing skill-sets and management entry rising from 2015 through 2021
FIG. 02 Job roles in flux. 47 percent had moved to a managerial role in the last two years; technology-and-strategy shift was the top driver at 66 percent. Generalist drift dominated specialist drift across the population.
Datacenter infrastructure findings. 49 percent own datacenters, 40 percent private cloud, 40 percent hybrid cloud, 35 percent public cloud. 71 percent had at least one cloud type. Datacenter tier distribution: tier 3 most common at 34 percent, tier 4 at 22 percent, tier 1 at 16 percent, tier 2 at 15 percent, tier 5 at 8 percent
FIG. 03 Infrastructure mix. 71 percent had at least one cloud type, on-prem still in the majority. Most respondent datacenters self-classified as Tier 3 or below.
Datacenter scale distribution. Physical server count: most under 100 servers, with respondent counts spanning 1-4 servers at 13 percent up to 5,000+ at 4 percent. Storage capacity ranges from 0-100 TB at 9 percent up to 1+ exabytes at 4 percent. Average total storage capacity rising sharply from 2014 through 2021
FIG. 04 Scale distribution. The respondent base spanned the full range, from organizations running 1—4 servers (13 percent) to those running 5,000+ (4 percent). Storage capacity skewed similarly wide, from under 100 TB to 1+ exabytes.
04 PowerEdge 17G Hardware Feedback qual · moderated IDIs

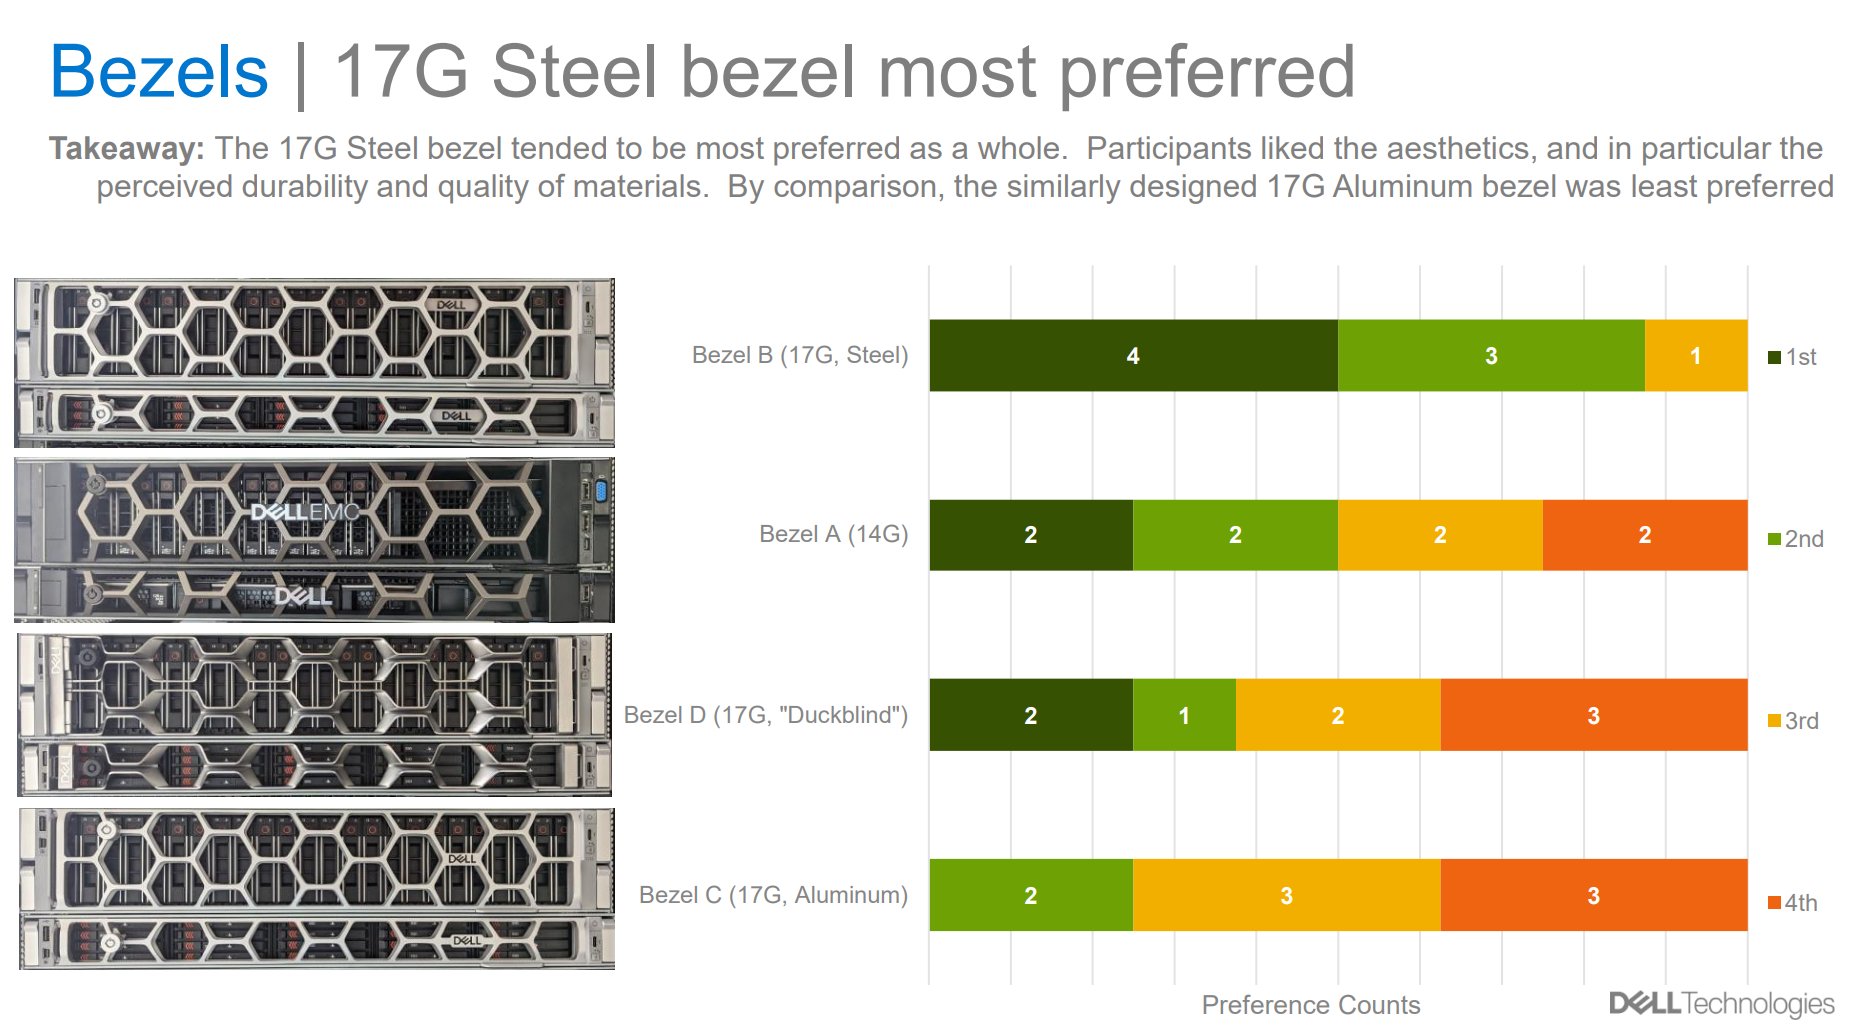
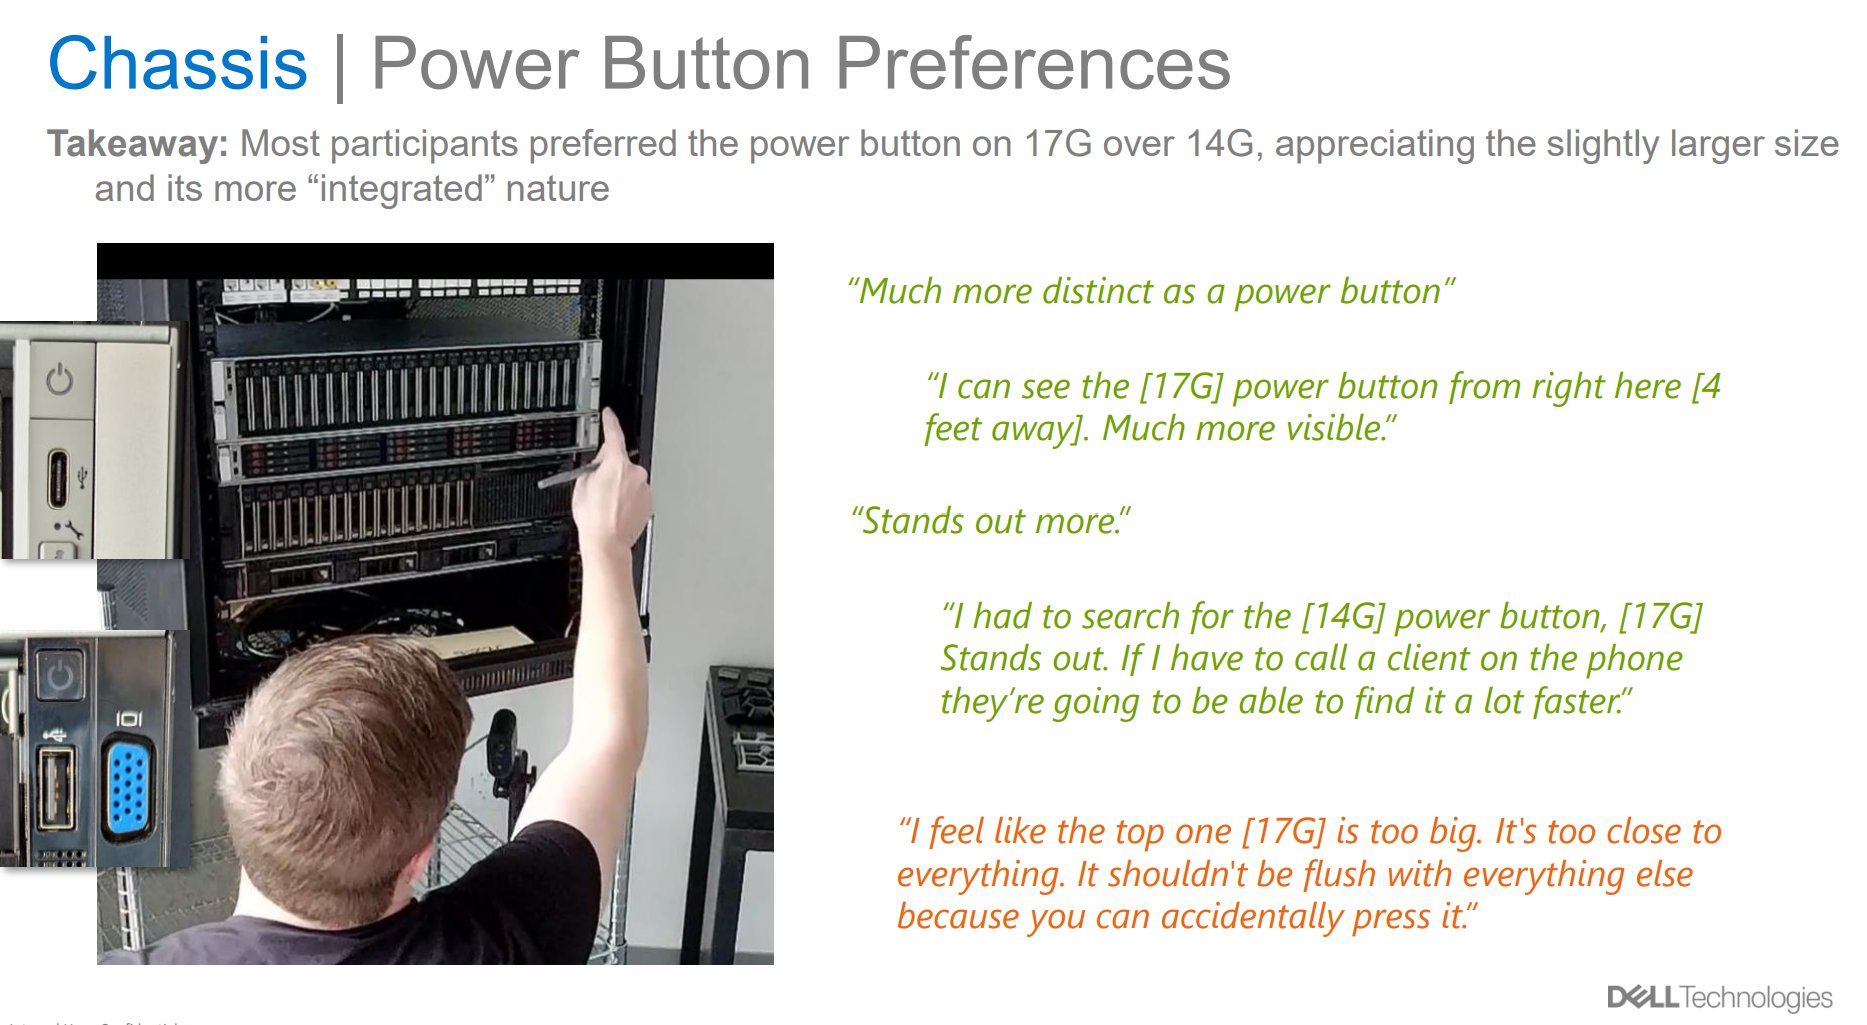
How would 16 IT Pros actually receive the 17G chassis?

Abstract n=16 · Dell Technologies Usability Lab, Seattle WA · Individual 1.5-hour moderated sessions · Comparative review of proposed 17G rack chassis, security bezels, and front I/O against the shipping 14G baseline · 17G "Steel" bezel most preferred; power button and health indicator favored over 14G; open questions on front I/O port selection.

Sixteen IT Pros, 1.5 hours each, ahead of tooling-lock on the 17G chassis. We ran 17G 1U and 2U models side-by-side with current 14G, rated three candidate security bezels against the shipping 14G bezel, and structured follow-up discussion to get at the why behind every preference.

Bezel preference chart showing 17G Steel bezel most preferred overall, with stacked bar chart of ranked preferences across four bezel options
FIG. 01 Forced-rank bezel preference. 17G Steel took first, the near-identical aluminum variant ranked last.
Power button preferences page with IT pro pointing at a server rack, alongside quoted participant feedback in green and orange
FIG. 02 Power button on 17G was clearly preferred, with one dissenting voice on accidental press risk.
Sustainability in the datacenter findings page showing respondent counts and takeaways about DC sustainability practices
FIG. 03 Adjacent finding: 14 of 16 ranked system performance over reducing carbon emissions.
Additional studies · in progress more to follow

Additional studies from the catalog will land here, same structure as above.

→ NEXT_CASE

Enterprise Horizons · strategic foresight framework.

Continue → 08/horizons