Context-aware enterprise UX.
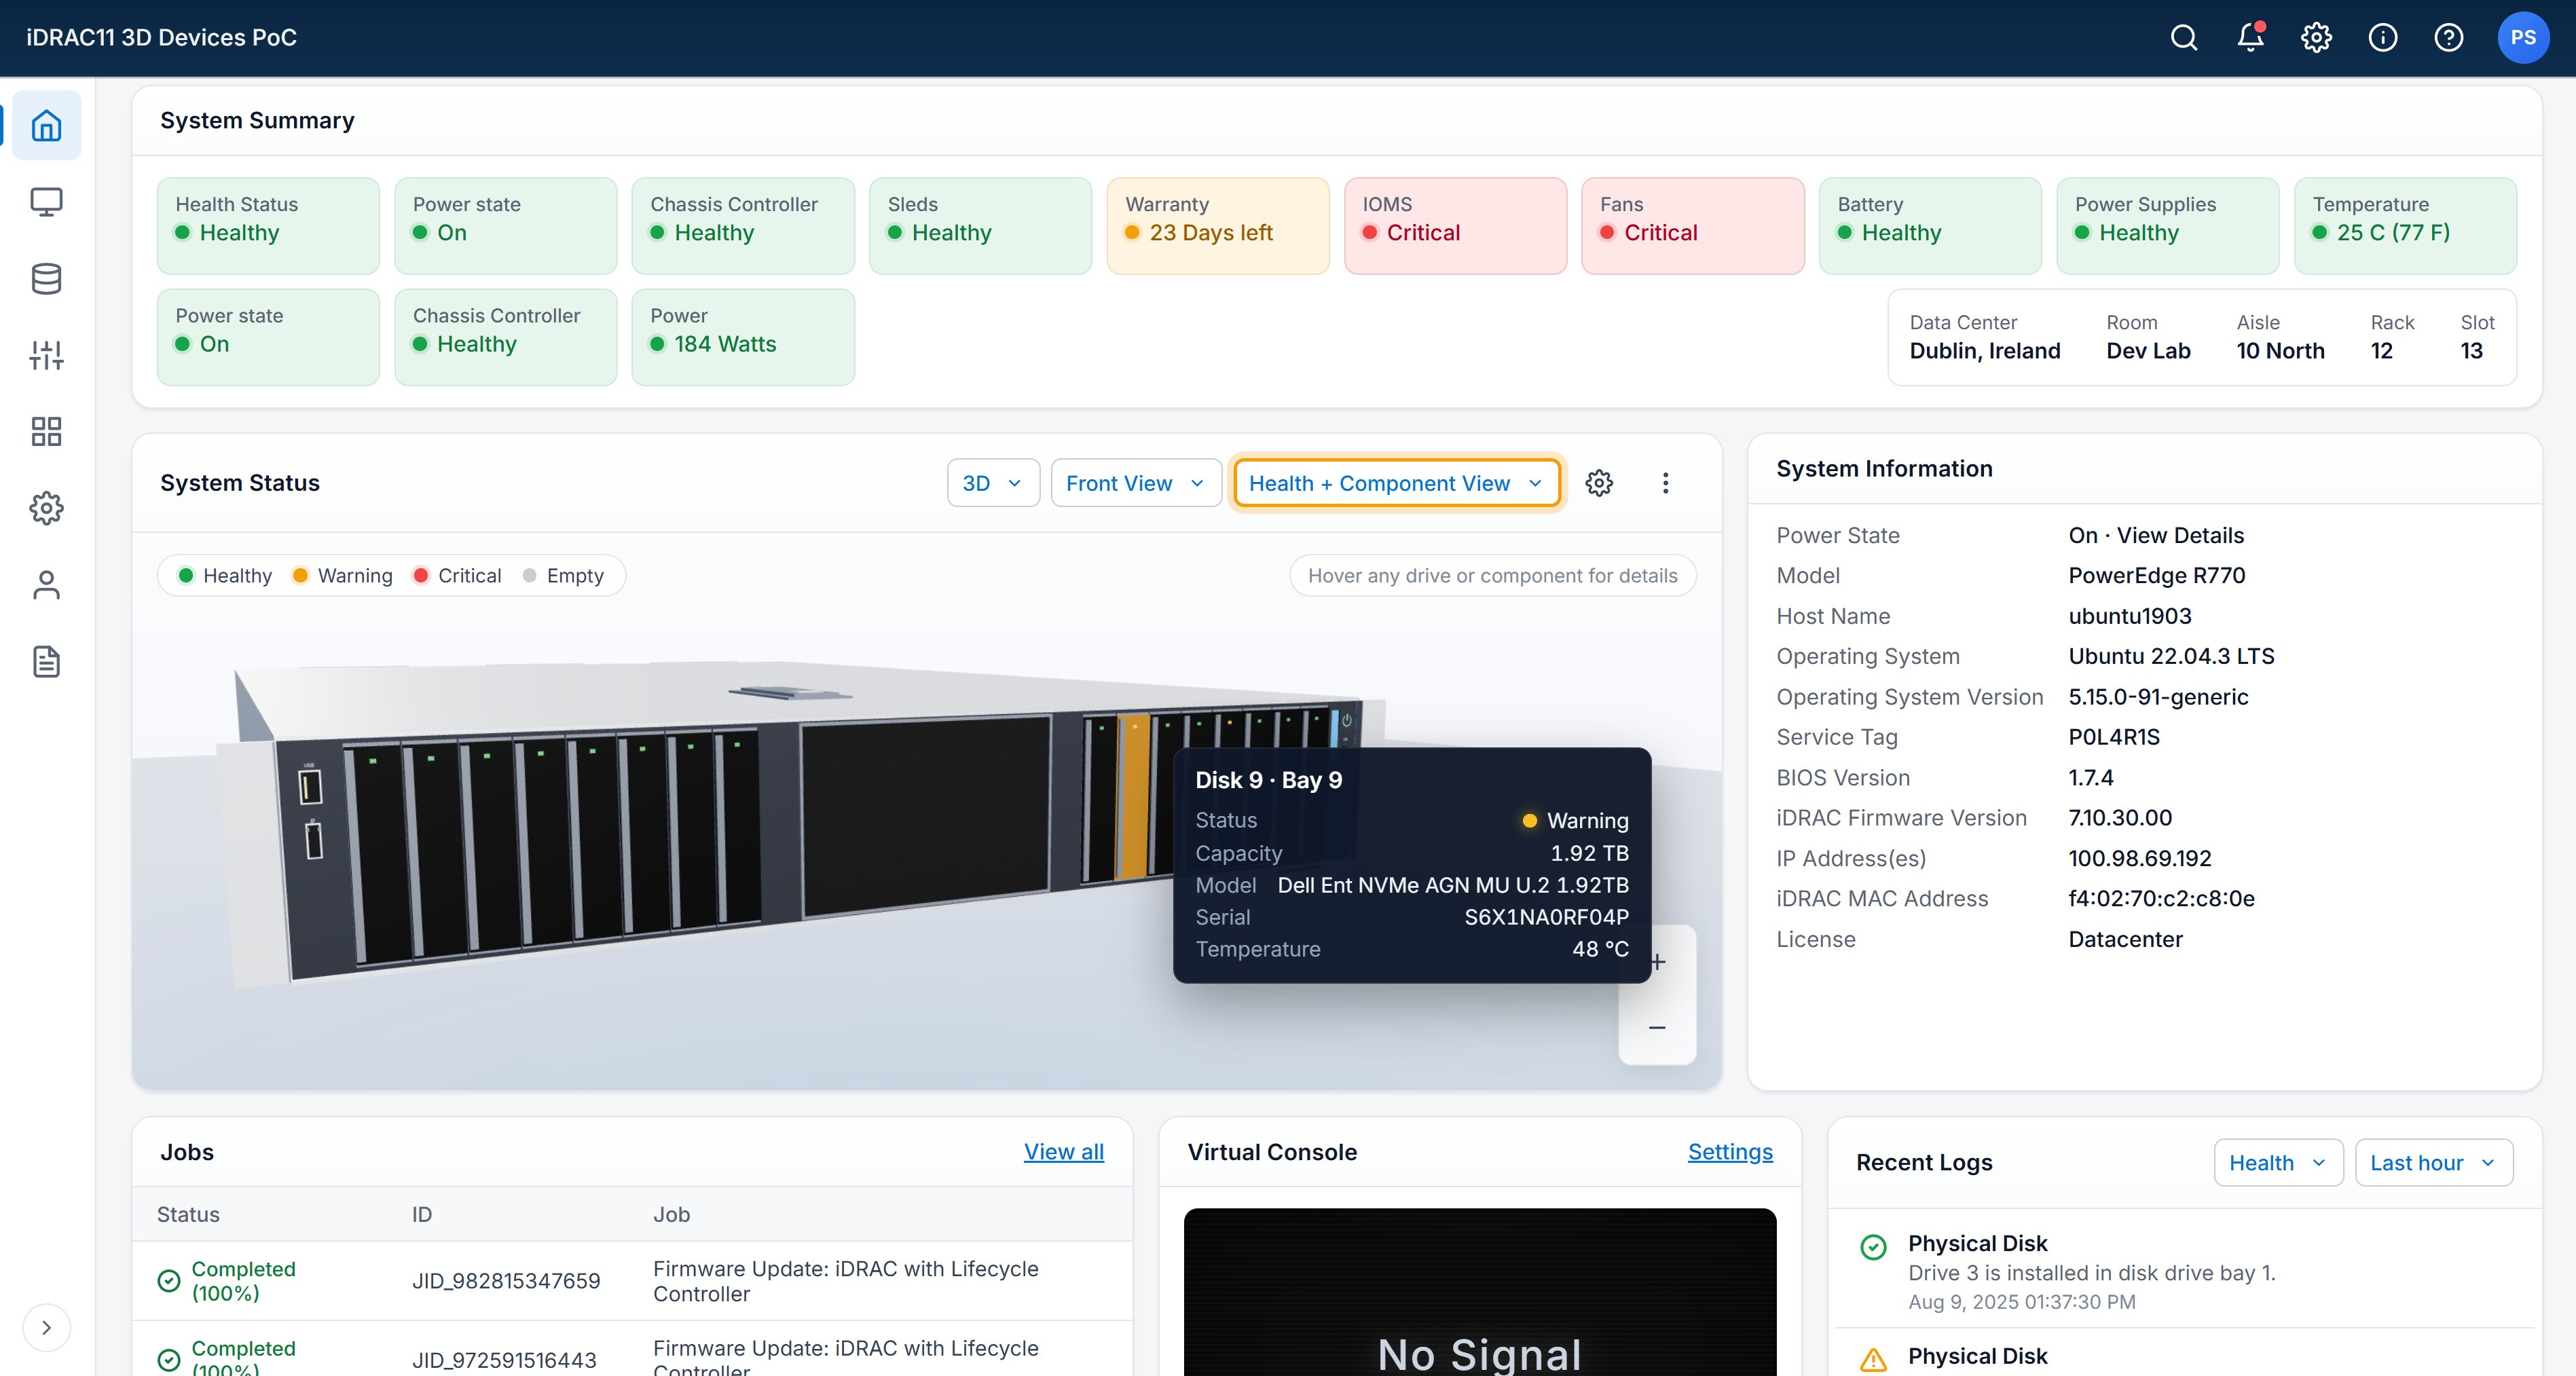
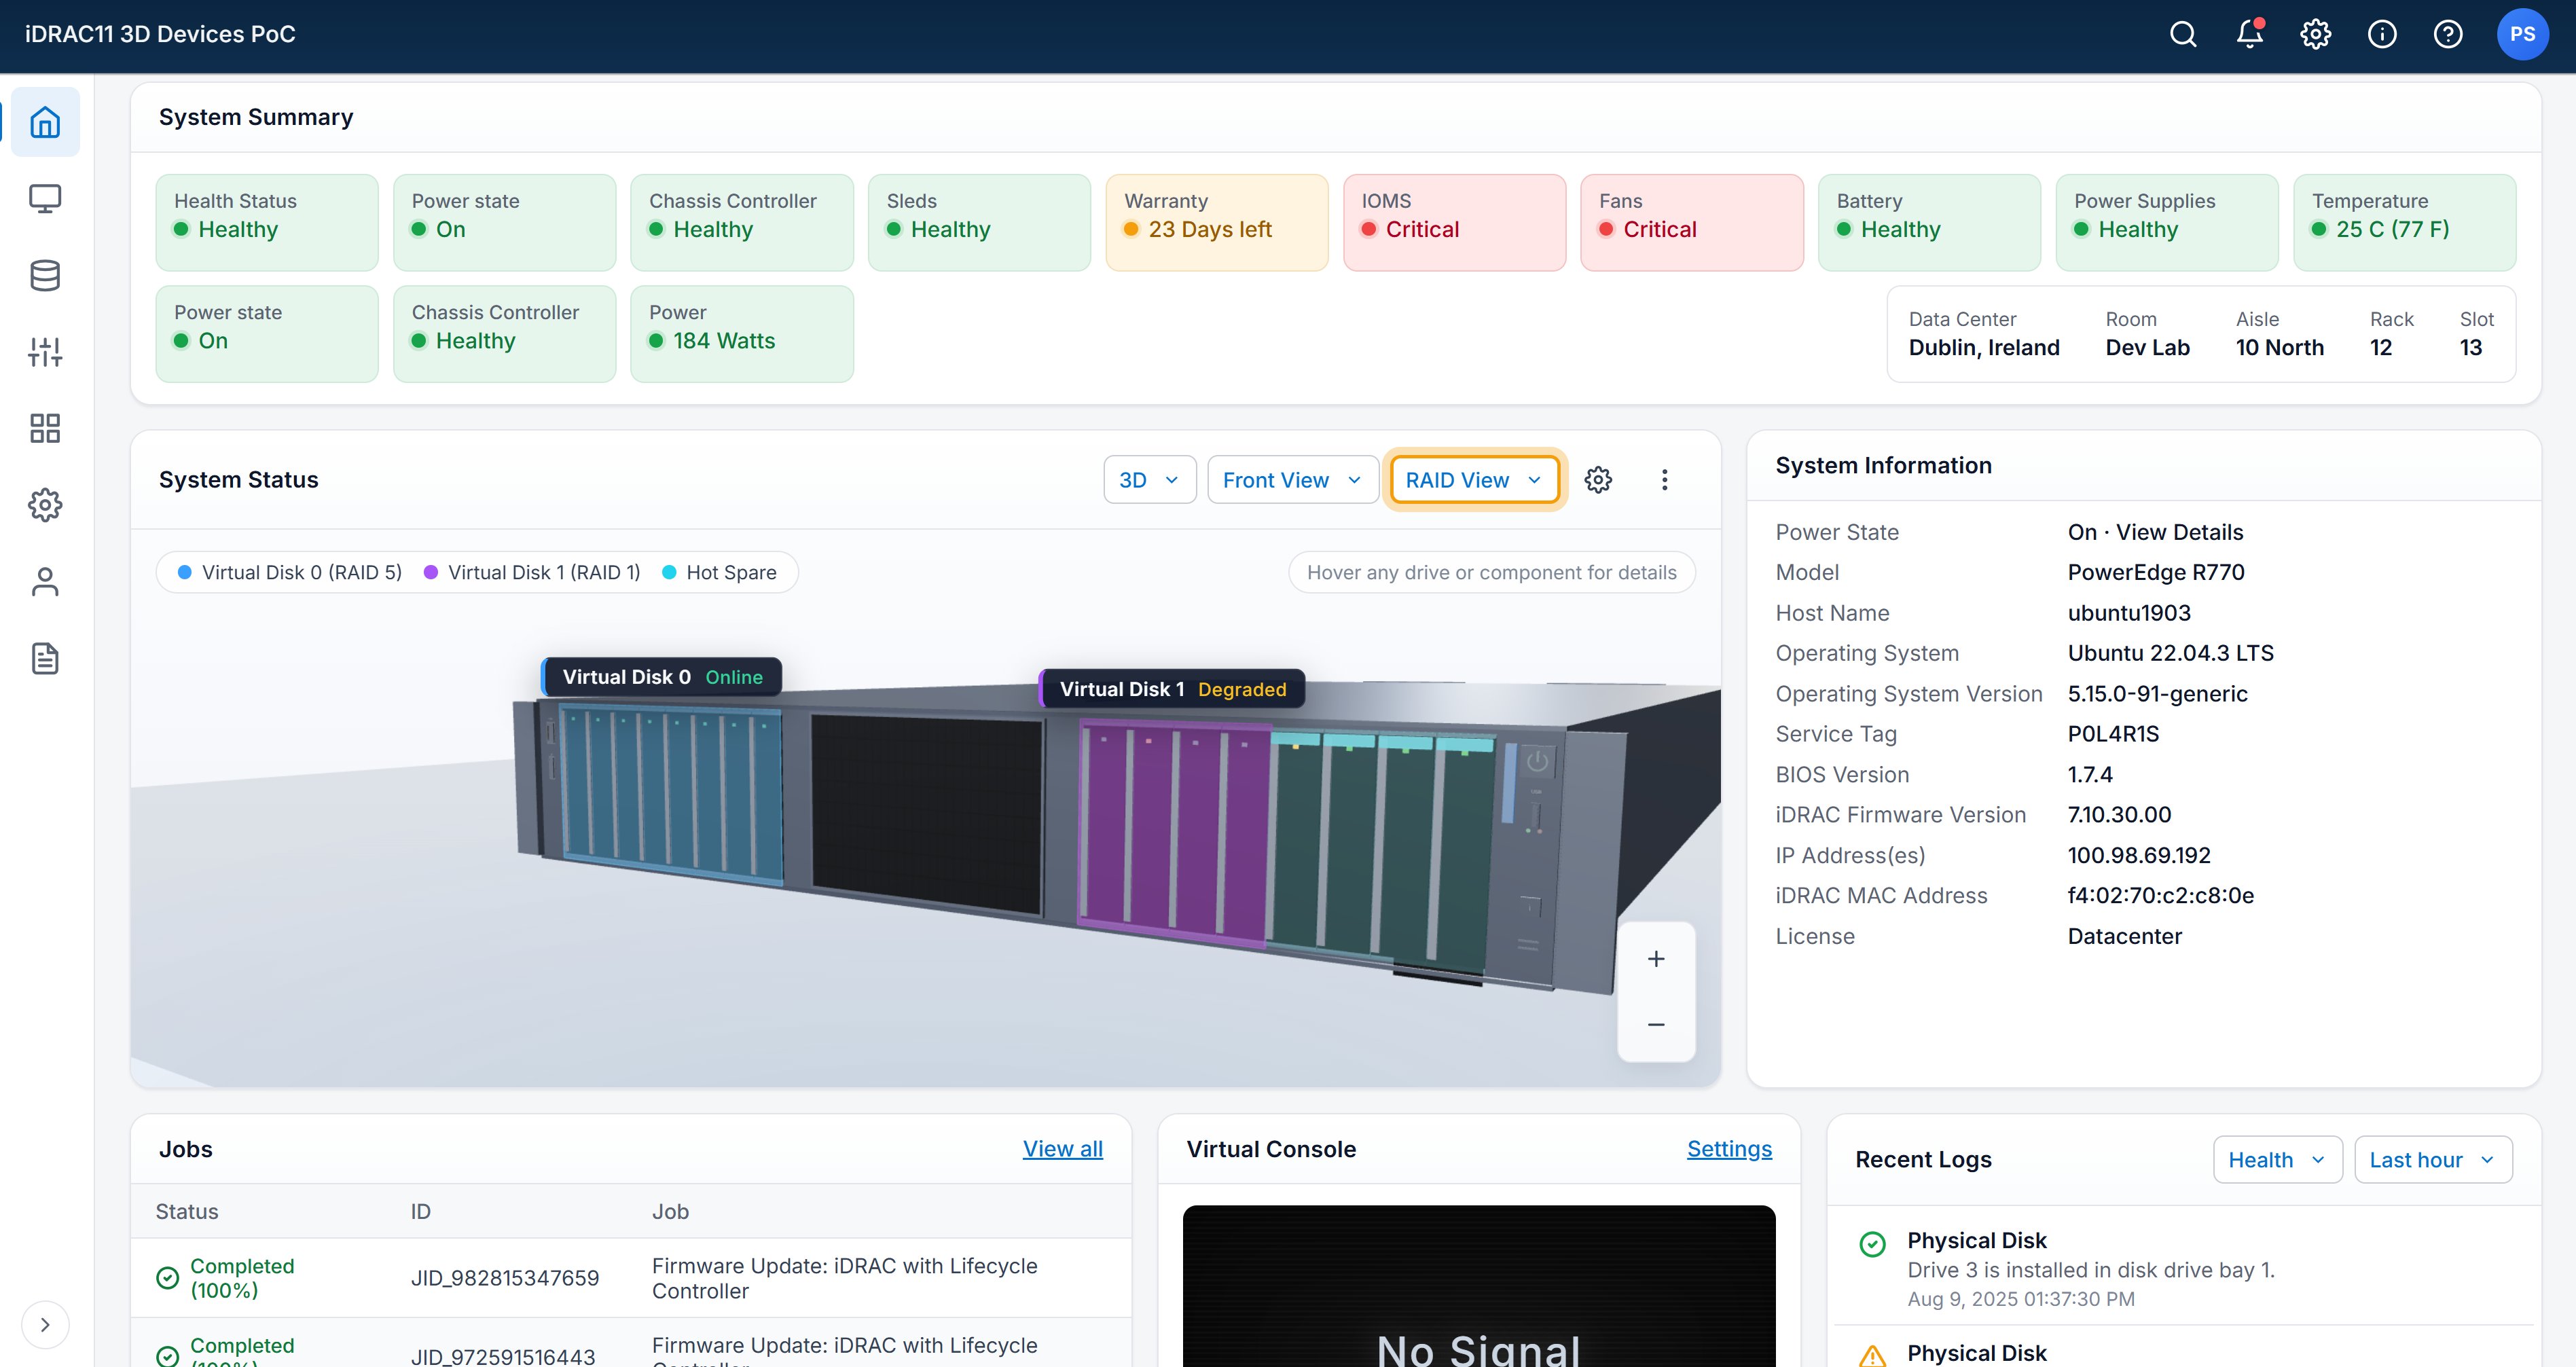
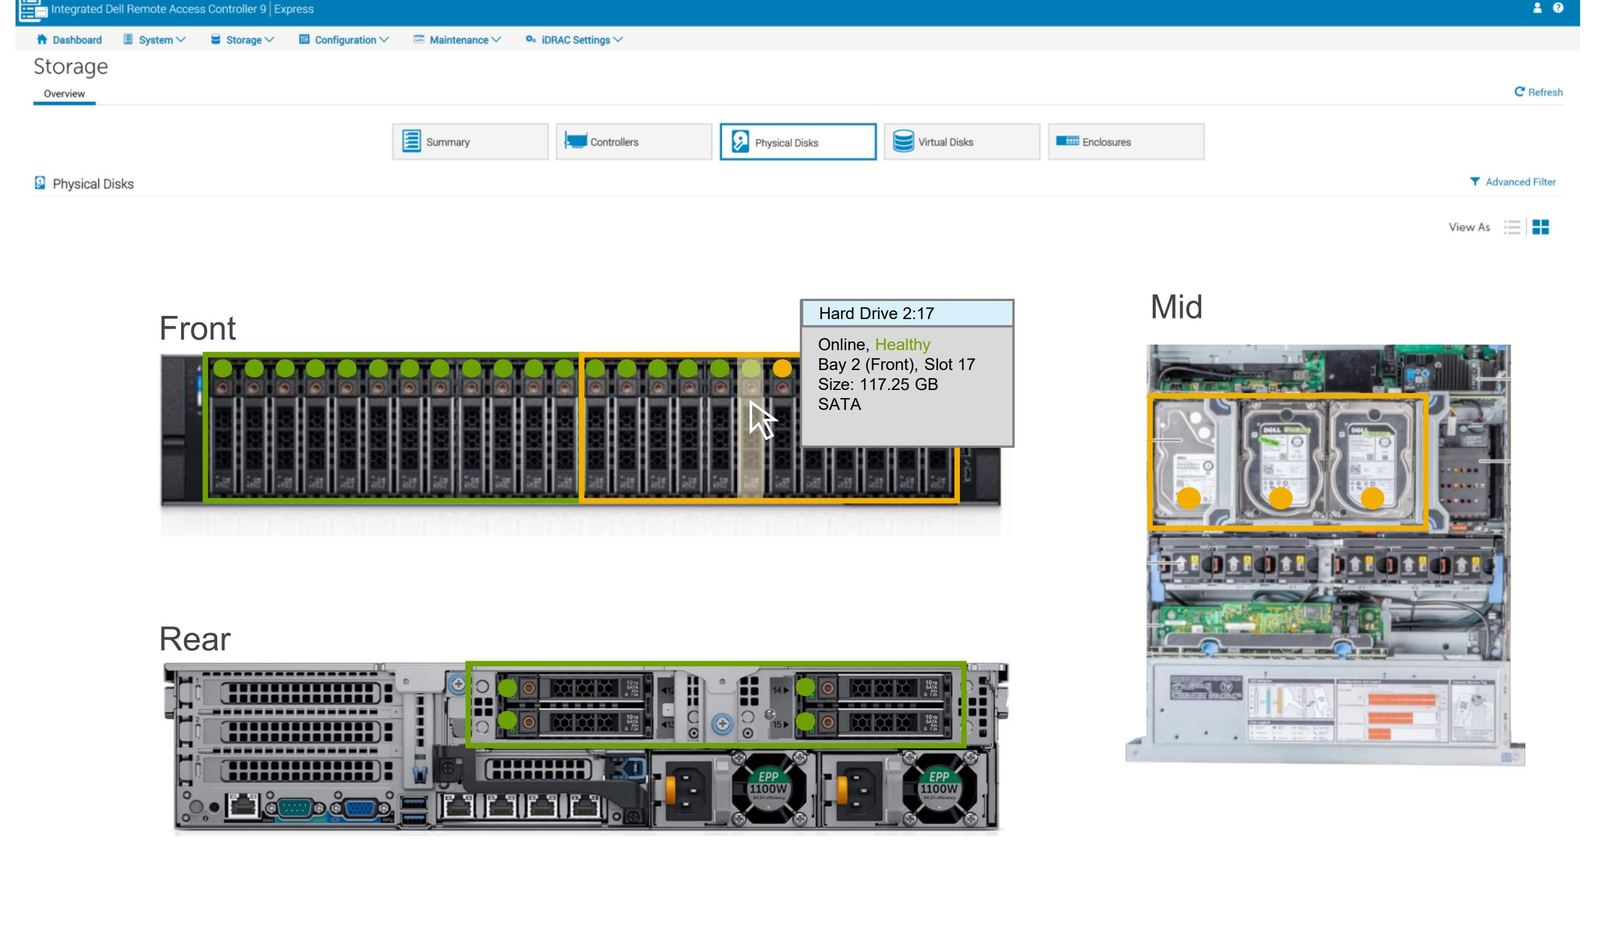
This didn't come from a PdM roadmap. It came from listening. Sitting with users, watching them manage server hardware remotely, seeing them squint at tables and reconstruct the machine in their heads. iDRAC is the 1:1 interface to the hardware. We redesigned it to match: Dynamically-populated SVG renderings of the actual hardware, with context-aware overlays on top. Seeing at a glance that your 1U has drives in slots 1-7 and 11-13, which drives are in a RAID together after a rebuild, and which one is the hot spare. The guesswork, gone. Shipped in iDRAC. The patents came after.
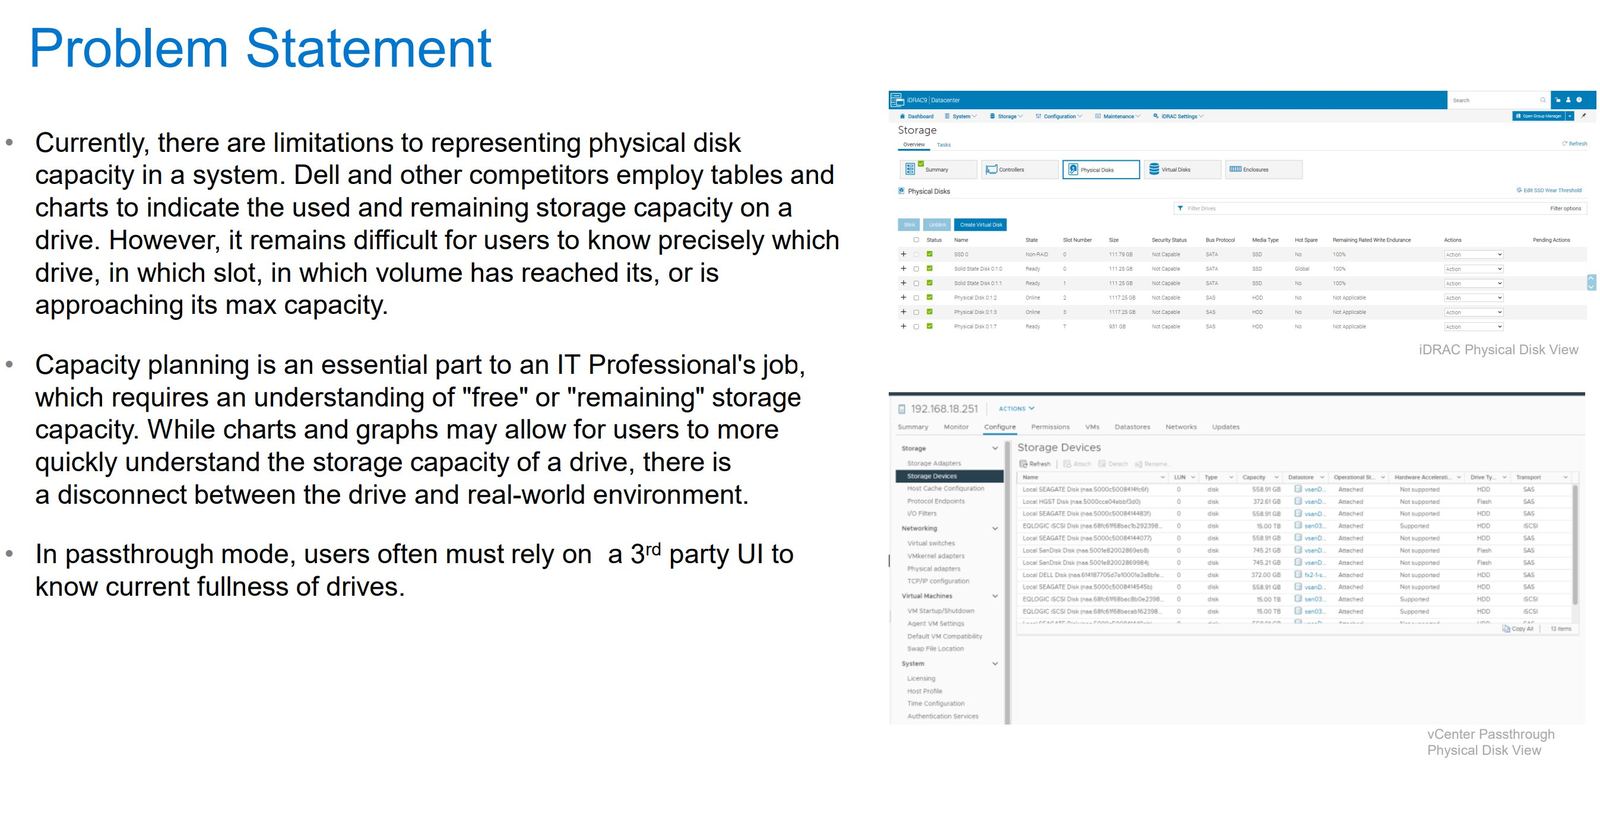
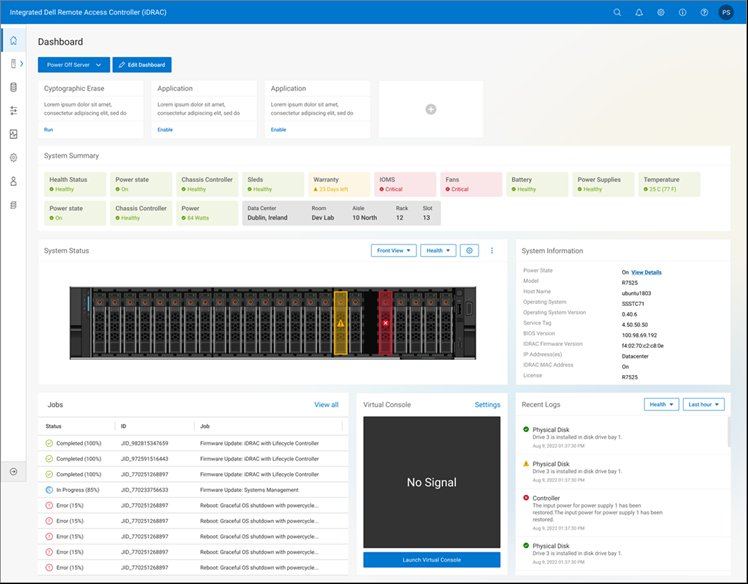
Hundreds of components. Text-heavy tables. A disconnect between the UI and the machine in front of you.
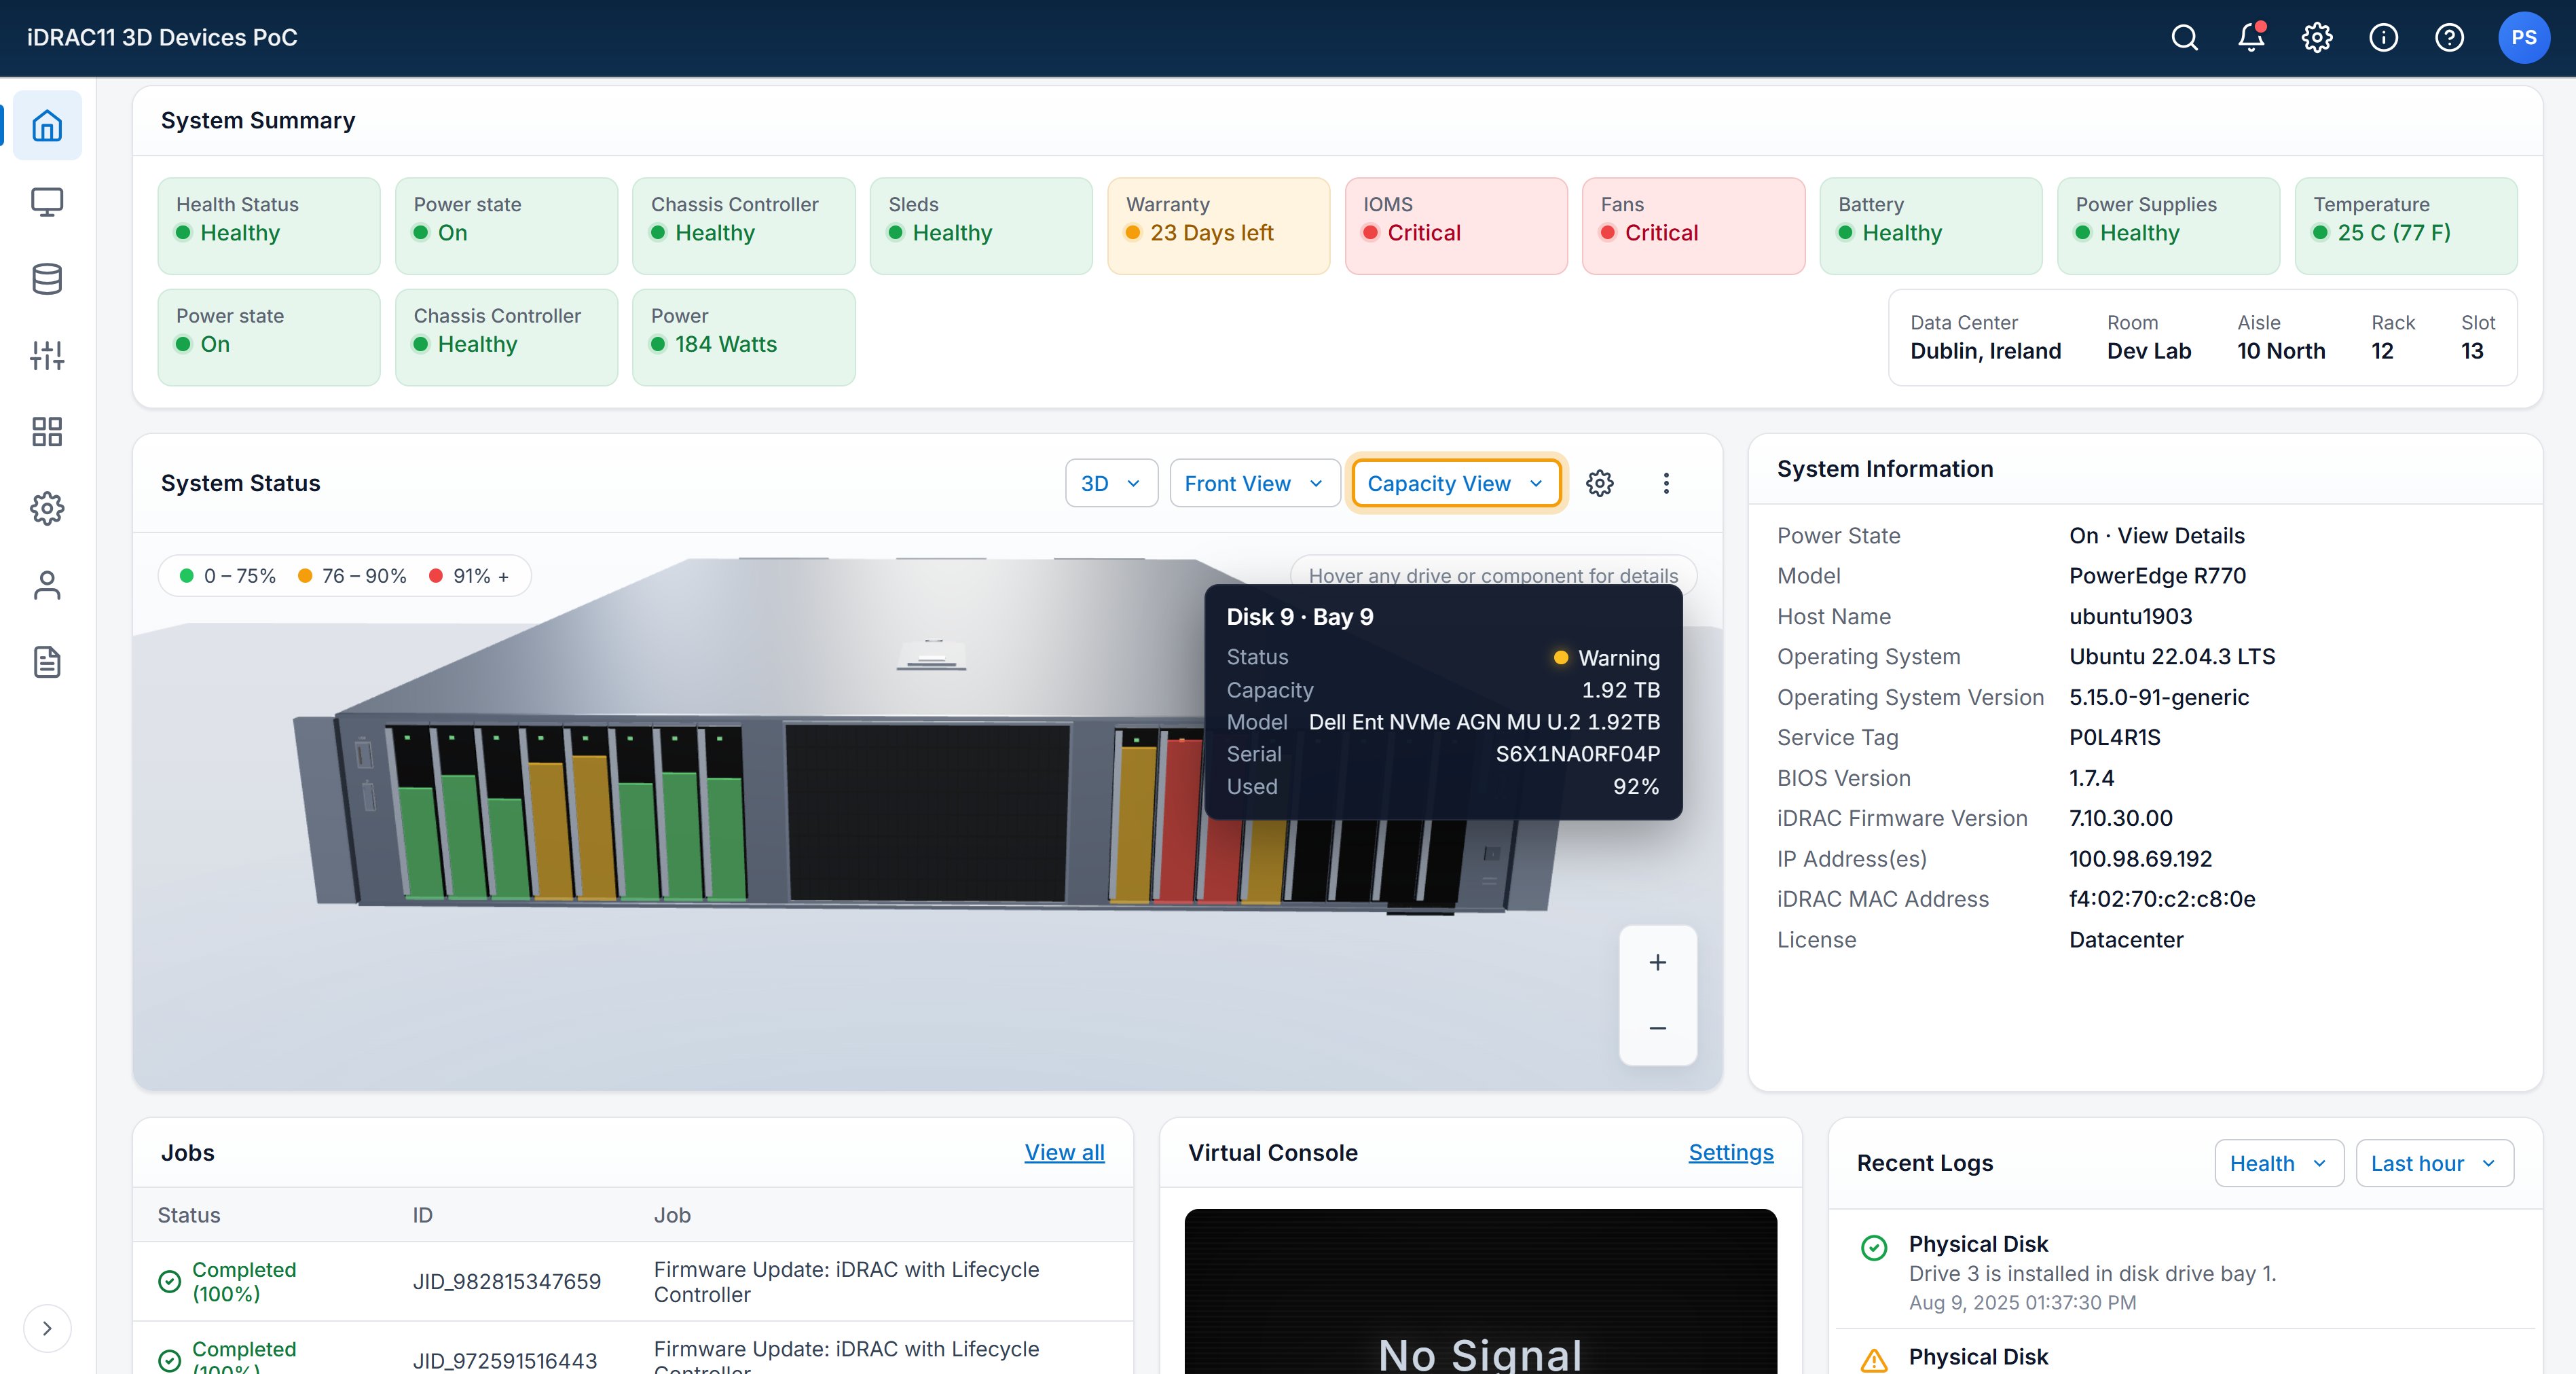
iDRAC and every comparable product represented sub-component state as tables. Drives, bays, sensors, RAID groups, virtual disks, hot spares, capacity, thermal, firmware. Hundreds of rows per server. Operators had to parse them, hold the chassis in their head, and cross-reference one against the other. The most expensive version of this was capacity planning, and in passthrough mode operators often had to leave iDRAC entirely for a third-party UI to see drive fullness.
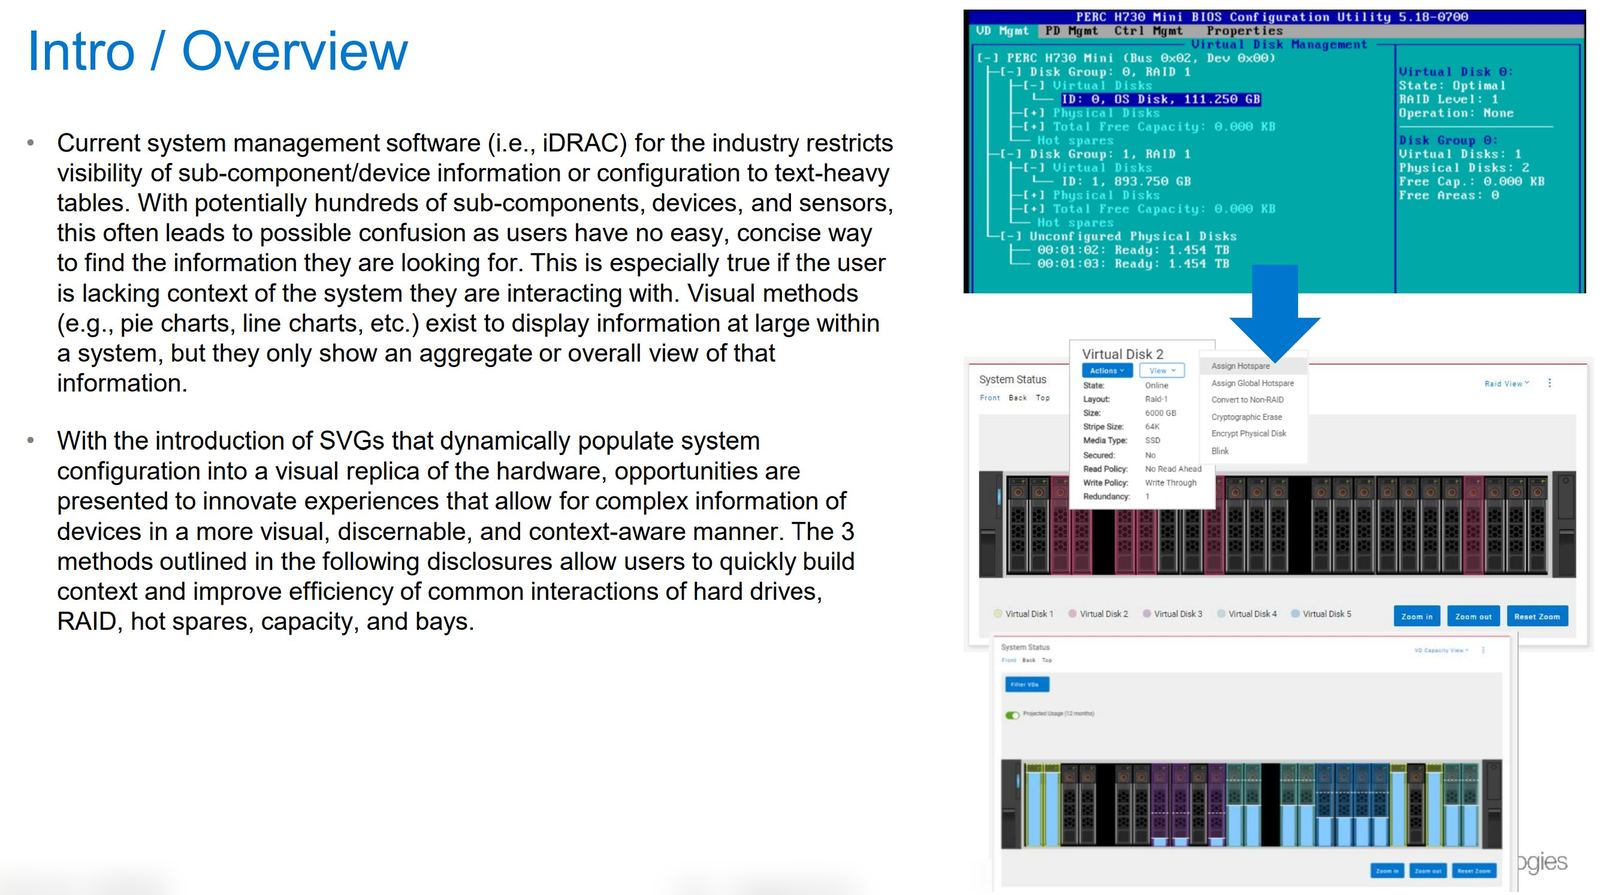
Render the hardware itself.
Stop translating the machine into a table. Render it. Every Dell chassis has a known physical topology and every deployed system has a known configuration, which makes a chassis drawable. This started in 2019 as a PowerPoint sketch. The shipped pattern came later: Device Imagery, a pre-authored SVG library of every chassis Dell ships, paired with a discovery layer that populates it from real-time system state. Once the base layer existed, the interesting question was what to draw on top of it.
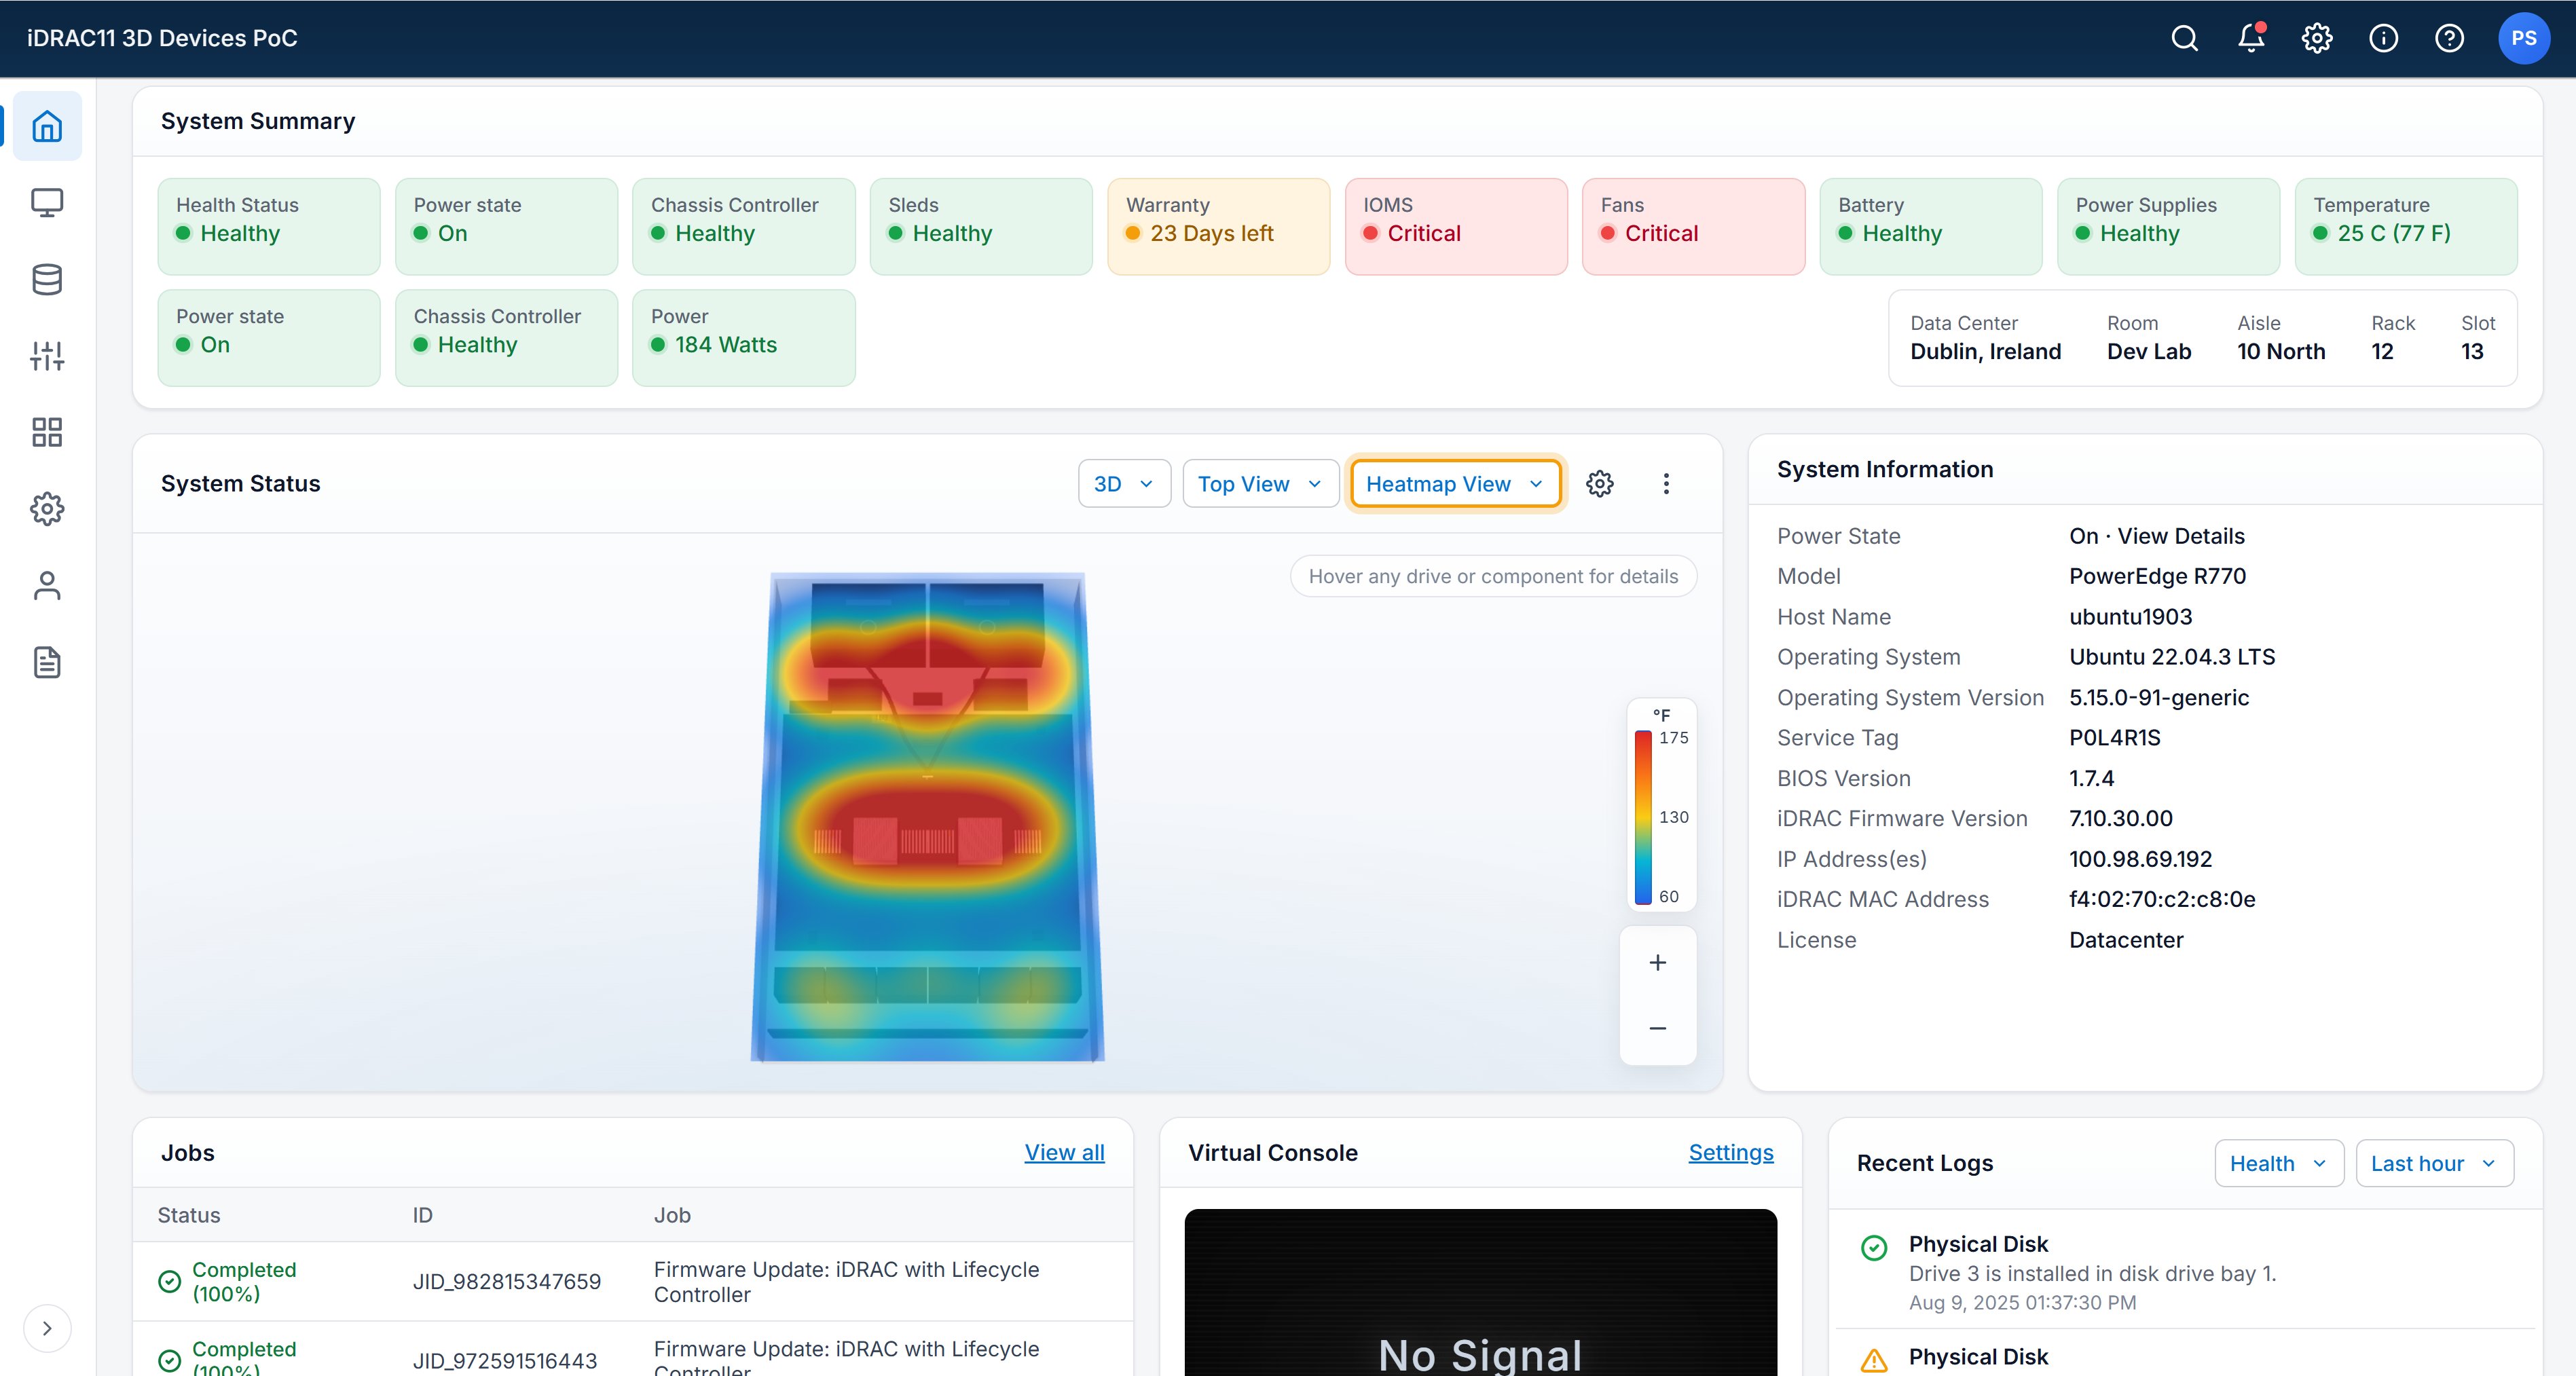
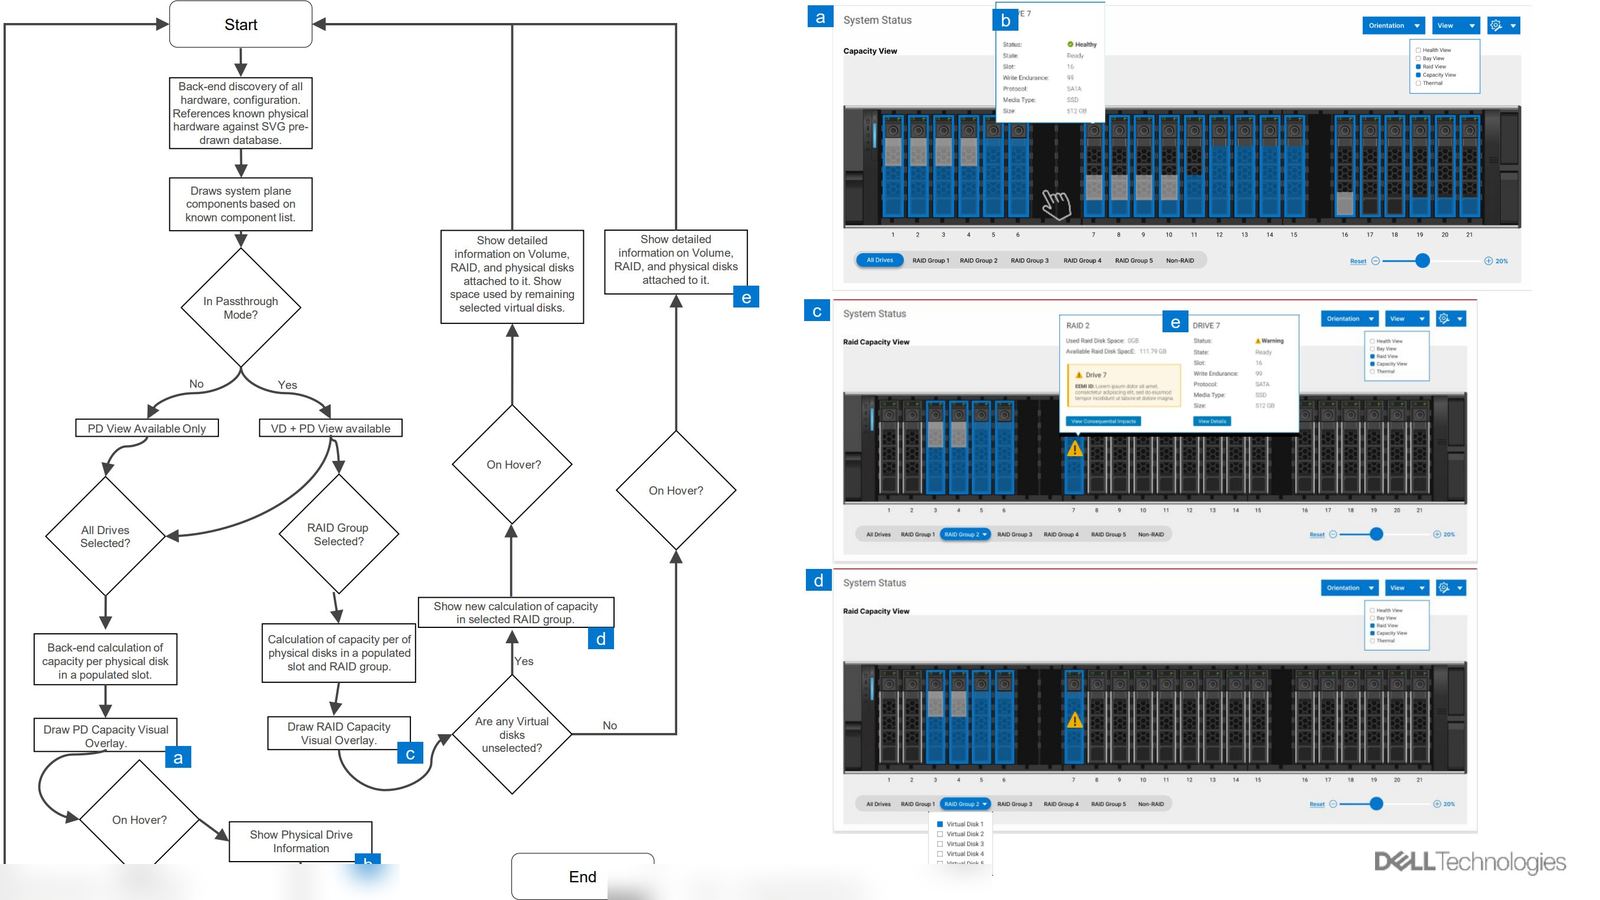
One base render. Multiple context overlays.
Device Imagery was the substrate. The real UX work was in the overlay system, a family of context-aware layers that render on top of the same SVG, each surfacing a different dimension of state for a different operator task. Two are worth walking through, each covered by its own filing in the patent family.
O.01 Capacity-View Overlay.
Answers what the tables couldn't: where, physically, is capacity being used? Colors every drive slot by fill state, scoped to what the operator has selected (all drives, a RAID group, or remaining space after selected VDs). Passthrough mode is handled natively, no third-party UI required.
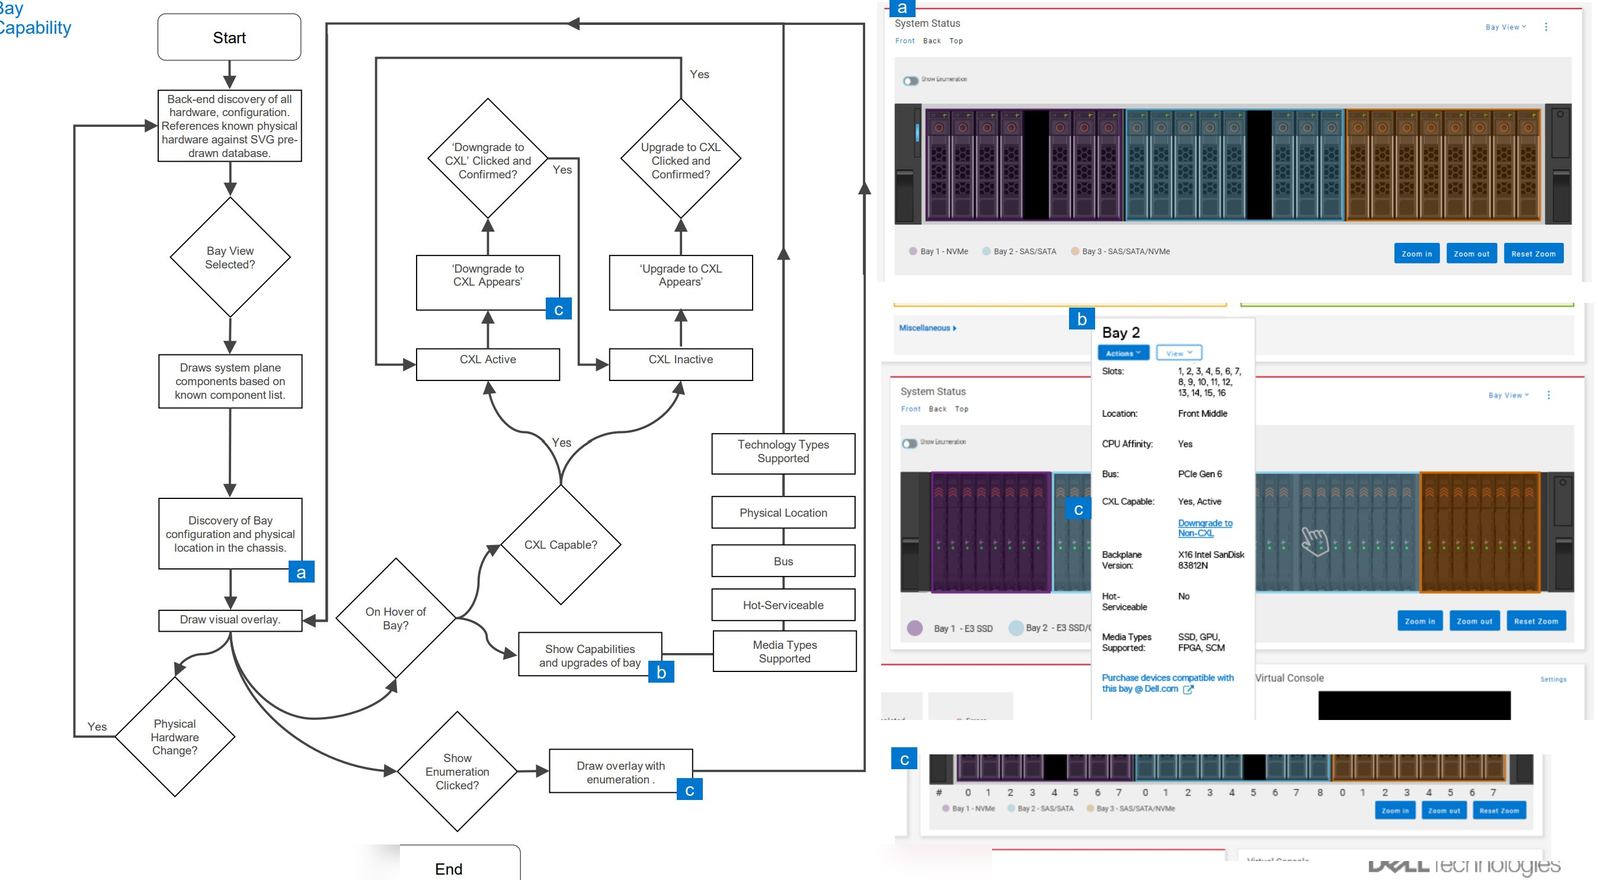
O.02 Bay Capability Overlay.
Answers a different question, one that got more important as CXL entered the portfolio: what is each bay capable of, and how do I upgrade? Hover a bay to see slot count, bus, media-type support, CPU affinity, backplane version, CXL capability. If a bay can upgrade to CXL, the action surfaces inline. If it can't, the overlay says so plainly.
Device Imagery, the capacity-view overlay, and the bay-capability overlay are each covered by separate filings. The pattern family is part of the 33 filed / 23 granted body of work from serving on the Enterprise HW Patent Committee. Specific claims and filings available on request.
Shipped in iDRAC. Now the default pattern.
Device Imagery and its overlay family shipped in iDRAC as Bay View. The SVG library and discovery layer now get reused across chassis SKUs. Operators don't describe this as "adaptive" or "context-aware." They describe it as "I can see the server." A context-aware UI that announces its context-awareness has failed.
Three more overlays in PoC.
Same base render, different operator tasks. The iDRAC11 3D Devices PoC carries the overlay pattern forward into a new visual format. Currently in socialization with PdM and Eng.